
Search for Indicators
All Data
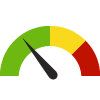
Indicator Gauge Icon Legend
Legend Colors
Red is bad, green is good, blue is not statistically different/neutral.
Compared to Distribution
 the value is in the best half of communities.
 the value is in the 2nd worst quarter of communities.
 the value is in the worst quarter of communities.
Compared to Target
 meets target;
  does not meet target.
Compared to a Single Value
 lower than the comparison value;
 higher than the comparison value;
 not statistically different from comparison value.
Trend

 non-significant change over time;
 significant change over time;
  no change over time.
Compared to Prior Value
 higher than the previous measurement period;
 lower than the previous measurement period;
 no statistically different change from previous measurement period.
State: Hawaii
Health / Children's Health
Value
Compared to:
State: Hawaii Blindness and Visual Impairment in Children
State: Hawaii Blindness and Visual Impairment in Children
0.7%
(2020-2021)
Compared to:
US Value
(42% in 2009-2010)
The regional value is compared to the U.S. value.
Prior Value
(0.3%)
Prior Value compares a measured value with the previously measured value. Confidence intervals were taken into account in determining the direction of the comparison.
State: Hawaii Children 3-17 with ADD/ADHD
State: Hawaii Children 3-17 with ADD/ADHD
5.9%
(2020-2021)
Compared to:
US Value
(9.5%)
The regional value is compared to the national value.
Prior Value
(5.4%)
Prior Value compares a measured value with the previously measured value. Confidence intervals were taken into account in determining the direction of the comparison.
Trend
This comparison measures the indicator’s values over multiple time periods.<br>The Mann-Kendall Test for Statistical Significance is used to evaluate the trend<br>over 4 to 10 periods of measure, subject to data availability and comparability.
45.8%
(2020-2021)
Compared to:

US Value
(45.3%)
The regional value is compared to the national value.
Prior Value
(53.7%)
Prior Value compares a measured value with the previously measured value. Confidence intervals were not taken into account in determining the direction of the comparison.
Trend
This comparison measures the indicator’s values over multiple time periods.<br>The Mann-Kendall Test for Statistical Significance is used to evaluate the trend<br>over 4 to 10 periods of measure, subject to data availability and comparability.
15.2%
(2020-2021)
Compared to:

US Value
(23.3%)
The regional value is compared to the national value.
Prior Value
(15.0%)
Prior Value compares a measured value with the previously measured value. Confidence intervals were taken into account in determining the direction of the comparison.
Trend
This comparison measures the indicator’s values over multiple time periods.<br>The Mann-Kendall Test for Statistical Significance is used to evaluate the trend<br>over 4 to 10 periods of measure, subject to data availability and comparability.
41.0%
(2020-2021)
Compared to:
US Value
(34.8%)
The regional value is compared to the national value.
Prior Value
(41.2%)
Prior Value compares a measured value with the previously measured value. Confidence intervals were taken into account in determining the direction of the comparison.
Trend
This comparison measures the indicator’s values over multiple time periods.<br>The Mann-Kendall Test for Statistical Significance is used to evaluate the trend<br>over 4 to 10 periods of measure, subject to data availability and comparability.
HP 2030 Target
(35.8%)
<div><span>MICH-17: Increase the proportion of children who receive a developmental screening<br /><br />The national indicator definition and data source are the same as for the state.</span></div>
State: Hawaii Wellness Guidelines for Early Childhood
State: Hawaii Wellness Guidelines for Early Childhood
1
(2017)
Compared to:
Prior Value
Prior Value compares a measured value with the previously measured value. Confidence intervals were not taken into account in determining the direction of the comparison.
Trend
This comparison measures the indicator’s values over multiple time periods.<br>The Mann-Kendall Test for Statistical Significance is used to evaluate the trend<br>over 4 to 10 periods of measure, subject to data availability and comparability.
PAN Plan Target
(1)
State: Hawaii
Health / Diabetes
Value
Compared to:
State: Hawaii Adults Who Bought Medications for Diabetes
State: Hawaii Adults Who Bought Medications for Diabetes
10.2%
(2023)
Compared to:


US Value
(10.7%)
The regional value is compared to the national value.
Prior Value
(10.1%)
Prior Value compares a measured value with the previously measured value. Confidence intervals were not taken into account in determining the direction of the comparison.
Trend
This comparison measures the indicator’s values over multiple time periods.<br>The Mann-Kendall Test for Statistical Significance is used to evaluate the trend<br>over 4 to 10 periods of measure, subject to data availability and comparability.
State: Hawaii Adults with a Diabetes Self-Management Plan
State: Hawaii Adults with a Diabetes Self-Management Plan
62.9%
(2019)
Compared to:
Prior Value
(64.3%)
Prior Value compares a measured value with the previously measured value. Confidence intervals were taken into account in determining the direction of the comparison.
Diabetes Plan Target
(69.8%)
State: Hawaii Adults with Diabetes
State: Hawaii Adults with Diabetes
11.7%
(2022)
Compared to:


Median Value for States and Territories
(11.6%)
The regional value is compared to the median value for states and territories.
Prior Value
(9.5%)
Prior Value compares a measured value with the previously measured value. Confidence intervals were taken into account in determining the direction of the comparison.
Trend
This comparison measures the indicator’s values over multiple time periods.<br>The Mann-Kendall Test for Statistical Significance is used to evaluate the trend<br>over 4 to 10 periods of measure, subject to data availability and comparability.
State: Hawaii Adults with Diabetes and A1c Value Greater than 9
State: Hawaii Adults with Diabetes and A1c Value Greater than 9
37.4%
(2021)
Compared to:
US Value
(29.8% in 2015)
The regional value is compared to the national value.
Prior Value
(38.5%)
Prior Value compares a measured value with the previously measured value. Confidence intervals were not taken into account in determining the direction of the comparison.
Trend
This comparison measures the indicator’s values over multiple time periods.<br>The Mann-Kendall Test for Statistical Significance is used to evaluate the trend<br>over 4 to 10 periods of measure, subject to data availability and comparability.
Diabetes Plan Target
(11.6%)
HP 2030 Target
(11.6%)
<div>D-03: Reduce the proportion of adults with diabetes who have an A1c value above 9%.</div>
<div> </div>
<div><span>The national indicator is defined in exactly the same way. The data source for the national indicator is the National Health and Nutrition Examination Survey, which is not conducted in Hawaii. The state data source is the Uniform Data System from Federally Qualified Health Centers which is collected comparably to the national data source among people who receive medical care at FQHCs.</span></div>
State: Hawaii Adults with New Cases of Diabetes
State: Hawaii Adults with New Cases of Diabetes
7.4
New cases per 1,000 population
(2021)
Compared to:
US Value
(8.5)
The regional value is compared to the national value.
Prior Value
(8.1)
Prior Value compares a measured value with the previously measured value. Confidence intervals were taken into account in determining the direction of the comparison.
Trend
This comparison measures the indicator’s values over multiple time periods.<br>The Mann-Kendall Test for Statistical Significance is used to evaluate the trend<br>over 4 to 10 periods of measure, subject to data availability and comparability.
Diabetes Plan Target
(4.8)
HP 2030 LHI
(4.8)
<div><span>D-01: Reduce the number of diabetes cases diagnosed yearly <strong>(LEADING HEALTH INDICATOR)</strong><br /><br />The national indicator includes adults aged 18-84. The data source for the national indicator is the National Health Interview Survey, from which state-level data for Hawaiʻi cannot be obtained. The state data source is the US Diabetes Surveillance System, which is comparable to the national data source.</span></div>
State: Hawaii Adults with Prediabetes
State: Hawaii Adults with Prediabetes
15.0%
(2022)
Compared to:
Prior Value
(16.4%)
Prior Value compares a measured value with the previously measured value. Confidence intervals were taken into account in determining the direction of the comparison.
Trend
This comparison measures the indicator’s values over multiple time periods.<br>The Mann-Kendall Test for Statistical Significance is used to evaluate the trend<br>over 4 to 10 periods of measure, subject to data availability and comparability.
State: Hawaii Diabetes Death Rate
State: Hawaii Diabetes Death Rate
17.0
Deaths per 100,000 population
(2022)
Compared to:
US Value
(25.4 in 2021)
The regional value is compared to the national value.
Prior Value
(16.9)
Prior Value compares a measured value with the previously measured value. Confidence intervals were taken into account in determining the direction of the comparison.
Trend
This comparison measures the indicator’s values over multiple time periods.<br>The Mann-Kendall Test for Statistical Significance is used to evaluate the trend<br>over 4 to 10 periods of measure, subject to data availability and comparability.
State: Hawaii Diabetes Death Rate (Multiple Cause of Death)
State: Hawaii Diabetes Death Rate (Multiple Cause of Death)
66.9
Deaths per 100,000 population
(2021)
Compared to:
US Value
(98.1)
The regional value is compared to the national value.
Prior Value
(62.2)
Prior Value compares a measured value with the previously measured value. Confidence intervals were taken into account in determining the direction of the comparison.
Trend
This comparison measures the indicator’s values over multiple time periods.<br>The Mann-Kendall Test for Statistical Significance is used to evaluate the trend<br>over 4 to 10 periods of measure, subject to data availability and comparability.
Diabetes Plan Target
(56.0)
State: Hawaii Diabetes: Medicare Population
State: Hawaii Diabetes: Medicare Population
27.0%
(2022)
Compared to:
U.S. States
The distribution is based on data from 50 U.S. states and the District of Columbia.
US Value
(24.0%)
The regional value is compared to the national value.
Prior Value
(26.0%)
Prior Value compares a measured value with the previously measured value. Confidence intervals were not taken into account in determining the direction of the comparison.
Trend
This comparison measures the indicator’s values over multiple time periods.<br>The Mann-Kendall Test for Statistical Significance is used to evaluate the trend<br>over 4 to 10 periods of measure, subject to data availability and comparability.
State: Hawaii High Risk Adults Tested for Diabetes
State: Hawaii High Risk Adults Tested for Diabetes
86.9
(2022)
Compared to:

Prior Value
(53.2)
Prior Value compares a measured value with the previously measured value. Confidence intervals were taken into account in determining the direction of the comparison.
Trend
This comparison measures the indicator’s values over multiple time periods.<br>The Mann-Kendall Test for Statistical Significance is used to evaluate the trend<br>over 4 to 10 periods of measure, subject to data availability and comparability.
Diabetes Plan Target
(67.5)
State: Hawaii Hospitalization for Diabetes among Adults 65+
State: Hawaii Hospitalization for Diabetes among Adults 65+
282.1
Hospitalizations per 100,000 population 65+ yrs
(2022)
Compared to:
Prior Value
(235.0)
Prior Value compares a measured value with the previously measured value. Confidence intervals were taken into account in determining the direction of the comparison.
Trend
This comparison measures the indicator’s values over multiple time periods.<br>The Mann-Kendall Test for Statistical Significance is used to evaluate the trend<br>over 4 to 10 periods of measure, subject to data availability and comparability.
HP 2030 Target
(264)
<div><span>OA-05: Reduce the rate of hospital admissions for diabetes among older adults<br /><br />The national indicator is defined in exactly the same way. The data source for the national indictor is the Healthcare Cost and Utilization Project. The state data source is Laulima, which is comparable to the national data source.</span></div>
State: Hawaii
Health / Disabilities
Value
Compared to:
State: Hawaii Adults with a Cognitive Disability
State: Hawaii Adults with a Cognitive Disability
9.1%
(2022)
Compared to:

Median Value for States and Territories
(13.4%)
The regional value is compared to the median value for states and territories.
Prior Value
(8.0%)
Prior Value compares a measured value with the previously measured value. Confidence intervals were taken into account in determining the direction of the comparison.
Trend
This comparison measures the indicator’s values over multiple time periods.<br>The Mann-Kendall Test for Statistical Significance is used to evaluate the trend<br>over 4 to 10 periods of measure, subject to data availability and comparability.
State: Hawaii Adults with a Disability
State: Hawaii Adults with a Disability
24.1%
(2022)
Compared to:
Median Value for States and Territories
(27.6% in 2019)
The regional value is compared to the median value for states and territories.
Prior Value
(22.5%)
Prior Value compares a measured value with the previously measured value. Confidence intervals were taken into account in determining the direction of the comparison.
Trend
This comparison measures the indicator’s values over multiple time periods.<br>The Mann-Kendall Test for Statistical Significance is used to evaluate the trend<br>over 4 to 10 periods of measure, subject to data availability and comparability.
State: Hawaii Adults with a Self-Care Disability
State: Hawaii Adults with a Self-Care Disability
2.2%
(2022)
Compared to:
Median Value for States and Territories
(3.5%)
The regional value is compared to the median value for states and territories.
Prior Value
(2.3%)
Prior Value compares a measured value with the previously measured value. Confidence intervals were taken into account in determining the direction of the comparison.
Trend
This comparison measures the indicator’s values over multiple time periods.<br>The Mann-Kendall Test for Statistical Significance is used to evaluate the trend<br>over 4 to 10 periods of measure, subject to data availability and comparability.
State: Hawaii Adults with a Vision Disability
State: Hawaii Adults with a Vision Disability
4.0%
(2022)
Compared to:
Median Value for States and Territories
(5.3%)
The regional value is compared to the median value for states and territories.
Prior Value
(3.3%)
Prior Value compares a measured value with the previously measured value. Confidence intervals were taken into account in determining the direction of the comparison.
Trend
This comparison measures the indicator’s values over multiple time periods.<br>The Mann-Kendall Test for Statistical Significance is used to evaluate the trend<br>over 4 to 10 periods of measure, subject to data availability and comparability.
State: Hawaii Adults with Activity Limitations due to Arthritis
State: Hawaii Adults with Activity Limitations due to Arthritis
35.5%
(2021)
Compared to:
Median Value for States and Territories
(41.4%)
The regional value is compared to the median value for states and territories.
Prior Value
(33.1%)
Prior Value compares a measured value with the previously measured value. Confidence intervals were taken into account in determining the direction of the comparison.
Trend
This comparison measures the indicator’s values over multiple time periods.<br>The Mann-Kendall Test for Statistical Significance is used to evaluate the trend<br>over 4 to 10 periods of measure, subject to data availability and comparability.
HP 2030 Target
(38.7%)
<div><span>A-02: Reduce the proportion of adults with arthritis whose arthritis limits their activities<br /> <br />The national indicator is defined in exactly the same way. The data source for the national indicator is the National Health Interview Survey, from which state-level data for Hawaii cannot be obtained. The state data source is the Behavioral Risk Factor Surveillance System, which is comparable to the national data source.</span></div>
State: Hawaii Adults with an Ambulatory Disability
State: Hawaii Adults with an Ambulatory Disability
10.7%
(2022)
Compared to:
Median Value for States and Territories
(13.3%)
The regional value is compared to the median value for states and territories.
Prior Value
(9.7%)
Prior Value compares a measured value with the previously measured value. Confidence intervals were taken into account in determining the direction of the comparison.
Trend
This comparison measures the indicator’s values over multiple time periods.<br>The Mann-Kendall Test for Statistical Significance is used to evaluate the trend<br>over 4 to 10 periods of measure, subject to data availability and comparability.
State: Hawaii Adults with an Independent Living Disability
State: Hawaii Adults with an Independent Living Disability
5.7%
(2022)
Compared to:
Median Value for States and Territories
(7.6%)
The regional value is compared to the median value for states and territories.
Prior Value
(5.0%)
Prior Value compares a measured value with the previously measured value. Confidence intervals were taken into account in determining the direction of the comparison.
Trend
This comparison measures the indicator’s values over multiple time periods.<br>The Mann-Kendall Test for Statistical Significance is used to evaluate the trend<br>over 4 to 10 periods of measure, subject to data availability and comparability.
State: Hawaii Adults with Disability Living in Poverty
State: Hawaii Adults with Disability Living in Poverty
19.9%
(2018-2022)
Compared to:

U.S. States
The distribution is based on data from 50 U.S. states and the District of Columbia.
US Value
(24.9%)
The regional value is compared to the national value.
Trend
This comparison measures the indicator’s values over multiple time periods.<br>The Mann-Kendall Test for Statistical Significance is used to evaluate the trend<br>over 4 to 10 periods of measure, subject to data availability and comparability.
State: Hawaii Adults with Work Limitations due to Arthritis
State: Hawaii Adults with Work Limitations due to Arthritis
27.9%
(2021)
Compared to:
Median Value for States and Territories
(29.9%)
The regional value is compared to the median value for states and territories.
Prior Value
(31.3%)
Prior Value compares a measured value with the previously measured value. Confidence intervals were taken into account in determining the direction of the comparison.
Trend
This comparison measures the indicator’s values over multiple time periods.<br>The Mann-Kendall Test for Statistical Significance is used to evaluate the trend<br>over 4 to 10 periods of measure, subject to data availability and comparability.
HP 2030 Target
(34.7%)
<div><span>A-03: Reduce the proportion of adults with arthritis whose arthritis limits their work<br /> <br />The national indicator is limited to adults aged 18-64. The data source for the national indicator is the National Health Interview Survey, from which state-level data for Hawaii cannot be obtained. The state data source is the Behavioral Risk Factor Surveillance System, which is comparable to the national data source.</span></div>
State: Hawaii Children with a Disability
State: Hawaii Children with a Disability
3.4%
(2018-2022)
Compared to:
US Value
(4.5%)
The regional value is compared to the national value.
Trend
This comparison measures the indicator’s values over multiple time periods.<br>The Mann-Kendall Test for Statistical Significance is used to evaluate the trend<br>over 4 to 10 periods of measure, subject to data availability and comparability.
State: Hawaii Employment Among Persons with Disabilities
State: Hawaii Employment Among Persons with Disabilities
29.0%
(2012)
Compared to:
Prior Value
(42.1%)
Prior Value compares a measured value with the previously measured value. Confidence intervals were not taken into account in determining the direction of the comparison.
State: Hawaii Persons with a Cognitive Difficulty
State: Hawaii Persons with a Cognitive Difficulty
4.9%
(2018-2022)
Compared to:

US Value
(5.3%)
The regional value is compared to the national value.
Trend
This comparison measures the indicator’s values over multiple time periods.<br>The Mann-Kendall Test for Statistical Significance is used to evaluate the trend<br>over 4 to 10 periods of measure, subject to data availability and comparability.
State: Hawaii Persons with a Disability
State: Hawaii Persons with a Disability
12.0%
(2018-2022)
Compared to:
US Value
(12.9%)
The regional value is compared to the national value.
Trend
This comparison measures the indicator’s values over multiple time periods.<br>The Mann-Kendall Test for Statistical Significance is used to evaluate the trend<br>over 4 to 10 periods of measure, subject to data availability and comparability.
State: Hawaii Persons with a Hearing Difficulty
State: Hawaii Persons with a Hearing Difficulty
3.8%
(2018-2022)
Compared to:

US Value
(3.6%)
The regional value is compared to the national value.
Trend
This comparison measures the indicator’s values over multiple time periods.<br>The Mann-Kendall Test for Statistical Significance is used to evaluate the trend<br>over 4 to 10 periods of measure, subject to data availability and comparability.
State: Hawaii Persons with a Self-Care Difficulty
State: Hawaii Persons with a Self-Care Difficulty
2.5%
(2018-2022)
Compared to:

US Value
(2.6%)
The regional value is compared to the national value.
Trend
This comparison measures the indicator’s values over multiple time periods.<br>The Mann-Kendall Test for Statistical Significance is used to evaluate the trend<br>over 4 to 10 periods of measure, subject to data availability and comparability.
State: Hawaii Persons with a Vision Difficulty
State: Hawaii Persons with a Vision Difficulty
2.0%
(2018-2022)
Compared to:
US Value
(2.4%)
The regional value is compared to the national value.
Trend
This comparison measures the indicator’s values over multiple time periods.<br>The Mann-Kendall Test for Statistical Significance is used to evaluate the trend<br>over 4 to 10 periods of measure, subject to data availability and comparability.
State: Hawaii Persons with an Ambulatory Difficulty
State: Hawaii Persons with an Ambulatory Difficulty
6.4%
(2018-2022)
Compared to:
US Value
(6.7%)
The regional value is compared to the national value.
Trend
This comparison measures the indicator’s values over multiple time periods.<br>The Mann-Kendall Test for Statistical Significance is used to evaluate the trend<br>over 4 to 10 periods of measure, subject to data availability and comparability.
State: Hawaii Unemployment Among Persons with Disabilities
State: Hawaii Unemployment Among Persons with Disabilities
10.7%
(2012)
Compared to:
Prior Value
(5.2%)
Prior Value compares a measured value with the previously measured value. Confidence intervals were not taken into account in determining the direction of the comparison.
State: Hawaii
Health / Family Planning
Value
Compared to:
State: Hawaii Abstain From Sex- Teen Boys
State: Hawaii Abstain From Sex- Teen Boys
80.4%
(2021)
Compared to:
US Value
(70.7%)
The regional value is compared to the national value.
Prior Value
(74.2%)
Prior Value compares a measured value with the previously measured value. Confidence intervals were taken into account in determining the direction of the comparison.
Trend
This comparison measures the indicator’s values over multiple time periods.<br>The Mann-Kendall Test for Statistical Significance is used to evaluate the trend<br>over 4 to 10 periods of measure, subject to data availability and comparability.
State: Hawaii Abstain From Sex- Teen Girls
State: Hawaii Abstain From Sex- Teen Girls
80.0%
(2021)
Compared to:
US Value
(69.4%)
The regional value is compared to the national value.
Prior Value
(70.6%)
Prior Value compares a measured value with the previously measured value. Confidence intervals were taken into account in determining the direction of the comparison.
Trend
This comparison measures the indicator’s values over multiple time periods.<br>The Mann-Kendall Test for Statistical Significance is used to evaluate the trend<br>over 4 to 10 periods of measure, subject to data availability and comparability.
State: Hawaii Abstain From Sex- Young Teen Boys
State: Hawaii Abstain From Sex- Young Teen Boys
96.4%
(2021)
Compared to:
Prior Value
(91.5%)
Prior Value compares a measured value with the previously measured value. Confidence intervals were taken into account in determining the direction of the comparison.
Trend
This comparison measures the indicator’s values over multiple time periods.<br>The Mann-Kendall Test for Statistical Significance is used to evaluate the trend<br>over 4 to 10 periods of measure, subject to data availability and comparability.
State: Hawaii Abstain From Sex- Young Teen Girls
State: Hawaii Abstain From Sex- Young Teen Girls
95.1%
(2021)
Compared to:
Prior Value
(94.7%)
Prior Value compares a measured value with the previously measured value. Confidence intervals were taken into account in determining the direction of the comparison.
Trend
This comparison measures the indicator’s values over multiple time periods.<br>The Mann-Kendall Test for Statistical Significance is used to evaluate the trend<br>over 4 to 10 periods of measure, subject to data availability and comparability.
State: Hawaii Births to Mothers Under 18 Years
State: Hawaii Births to Mothers Under 18 Years
0.6%
% of births to mothers <18
(2021)
Compared to:
Prior Value
(0.7%)
Prior Value compares a measured value with the previously measured value. Confidence intervals were taken into account in determining the direction of the comparison.
Trend
This comparison measures the indicator’s values over multiple time periods.<br>The Mann-Kendall Test for Statistical Significance is used to evaluate the trend<br>over 4 to 10 periods of measure, subject to data availability and comparability.
State: Hawaii Condom Use Among Teen Boys
State: Hawaii Condom Use Among Teen Boys
45.1%
(2021)
Compared to:

US Value
(57.7%)
The regional value is compared to the national value.
Prior Value
(48.3%)
Prior Value compares a measured value with the previously measured value. Confidence intervals were taken into account in determining the direction of the comparison.
Trend
This comparison measures the indicator’s values over multiple time periods.<br>The Mann-Kendall Test for Statistical Significance is used to evaluate the trend<br>over 4 to 10 periods of measure, subject to data availability and comparability.
HP 2030 Target
(81.3%)
<div>
<p>FP-06: Increase the proportion of adolescent males who used a condom the last time they had sex</p>
<p>The national indicator is defined differently as it is for adolescents aged 15-19. The data source for the national indicator is the National Survey of Family Growth, from which state-level data for Hawai‘i cannot be obtained. The state data source is the Youth Risk Behavior Survey, which is comparable to the national data source.</p>
</div>
State: Hawaii Infants Born to Mothers with <12 Yrs Education
State: Hawaii Infants Born to Mothers with <12 Yrs Education
15.8%
(2021)
Compared to:
US Value
(11.1%)
The regional value is compared to the national value.
Prior Value
(16.9%)
Prior Value compares a measured value with the previously measured value. Confidence intervals were taken into account in determining the direction of the comparison.
Trend
This comparison measures the indicator’s values over multiple time periods.<br>The Mann-Kendall Test for Statistical Significance is used to evaluate the trend<br>over 4 to 10 periods of measure, subject to data availability and comparability.
State: Hawaii Pregnancies Among Females Aged 15-19 Years
State: Hawaii Pregnancies Among Females Aged 15-19 Years
17.4
Pregnancies per 1,000 females aged 15-19
(2021)
Compared to:
US Value
(31.0 in 2017)
The regional value is compared to the national value.
Prior Value
(17.6)
Prior Value compares a measured value with the previously measured value. Confidence intervals were not taken into account in determining the direction of the comparison.
Trend
This comparison measures the indicator’s values over multiple time periods.<br>The Mann-Kendall Test for Statistical Significance is used to evaluate the trend<br>over 4 to 10 periods of measure, subject to data availability and comparability.
HP 2030 Target
(31.4)
<div><span>FP-03: Reduce pregnancies in adolescents<br /> <br />The national indicator definition and data source are the same as for the state.</span></div>
State: Hawaii Pregnancies that Are Intended
State: Hawaii Pregnancies that Are Intended
57.6%
(2021)
Compared to:
US Value
(60.4% in 2020)
The regional value is compared to the national value.
Prior Value
(54.5%)
Prior Value compares a measured value with the previously measured value. Confidence intervals were taken into account in determining the direction of the comparison.
Trend
This comparison measures the indicator’s values over multiple time periods.<br>The Mann-Kendall Test for Statistical Significance is used to evaluate the trend<br>over 4 to 10 periods of measure, subject to data availability and comparability.
HP 2030 Target
(36.5%)
<div><span>FP-01: Reduce the proportion of unintended pregnancies<br /><br />The national indicator definition is limited to women aged 15-44 and uses live births as well as abortions and fetal losses for the denominator. The data source for the national indicator is the National Survey of Family Growth, from which state-level data for Hawaii cannot be obtained. The state data source is the Pregnancy Risk Assessment Monitoring System, which is comparable to the national data source.</span></div>
State: Hawaii Teen Birth Rate
State: Hawaii Teen Birth Rate
11.7
Births per 1,000 women aged 15-19 years
(2022)
Compared to:
US Value
(13.9 in 2021)
The regional value is compared to the national value.
Prior Value
(12.4)
Prior Value compares a measured value with the previously measured value. Confidence intervals were taken into account in determining the direction of the comparison.
Trend
This comparison measures the indicator’s values over multiple time periods.<br>The Mann-Kendall Test for Statistical Significance is used to evaluate the trend<br>over 4 to 10 periods of measure, subject to data availability and comparability.
60.3%
(2021)
Compared to:

US Value
(84.8%)
The regional value is compared to the national value.
Prior Value
(62.4%)
Prior Value compares a measured value with the previously measured value. Confidence intervals were taken into account in determining the direction of the comparison.
Trend
This comparison measures the indicator’s values over multiple time periods.<br>The Mann-Kendall Test for Statistical Significance is used to evaluate the trend<br>over 4 to 10 periods of measure, subject to data availability and comparability.
HP 2030 Target
(36.8%)
<div><span>FP-05: Increase the proportion of adolescent females at risk for unintended pregnancy who use effective birth control<br /><br />The data source for the national indicator is the National Survey of Family Growth, from which state-level data for Hawaii cannot be obtained. The state data source is the Youth Risk Behavior Survey of high school students, which is comparable to the national data source. </span></div>
50.7%
(2020)
Compared to:
Prior Value
(55.3%)
Prior Value compares a measured value with the previously measured value. Confidence intervals were taken into account in determining the direction of the comparison.
HP 2030 Target
(65.1%)
<div><span>FP-10: Increase the proportion of women at risk for unintended pregnancy who use effective birth control<br /><br />The data source for the national indicator only includes most effective or moderately effective methods of contraception and is the National Survey of Family Growth, from which state-level data for Hawaii cannot be obtained. The state data source is the Behavioral Risk Factor Surveillance System, which is comparable to the national data source.</span></div>
State: Hawaii
Health / Health Care Access & Quality
Value
Compared to:
State: Hawaii Adolescents Who Speak Privately with a HC Provider
State: Hawaii Adolescents Who Speak Privately with a HC Provider
56.8%
(2020-2021)
Compared to:
US Value
(53.7%)
The regional value is compared to the national value.
Prior Value
(59.4%)
Prior Value compares a measured value with the previously measured value. Confidence intervals were taken into account in determining the direction of the comparison.
Trend
This comparison measures the indicator’s values over multiple time periods.<br>The Mann-Kendall Test for Statistical Significance is used to evaluate the trend<br>over 4 to 10 periods of measure, subject to data availability and comparability.
HP 2030 Target
(43.3%)
<div><span>AH-02: Increase the proportion of adolescents who speak privately with a provider at the preventive medical visit<br /><br />The national indicator definition and data source are the same as for the state.</span></div>
State: Hawaii Adults Who Did Not See a Doctor Due to Cost
State: Hawaii Adults Who Did Not See a Doctor Due to Cost
5.7%
(2022)
Compared to:
Median Value for States and Territories
(10.1%)
The regional value is compared to the median value for states and territories.
Prior Value
(5.3%)
Prior Value compares a measured value with the previously measured value. Confidence intervals were taken into account in determining the direction of the comparison.
Trend
This comparison measures the indicator’s values over multiple time periods.<br>The Mann-Kendall Test for Statistical Significance is used to evaluate the trend<br>over 4 to 10 periods of measure, subject to data availability and comparability.
State: Hawaii Adults who go to the Doctor Regularly for Checkups
State: Hawaii Adults who go to the Doctor Regularly for Checkups
78.6%
(2023)
Compared to:
US Value
(74.2%)
The regional value is compared to the national value.
Prior Value
(81.1%)
Prior Value compares a measured value with the previously measured value. Confidence intervals were not taken into account in determining the direction of the comparison.
State: Hawaii Adults who have had a Routine Checkup
State: Hawaii Adults who have had a Routine Checkup
76.8%
(2022)
Compared to:
Median Value for States and Territories
(75.5% in 2021)
The regional value is compared to the median value for states and territories.
Prior Value
(74.8%)
Prior Value compares a measured value with the previously measured value. Confidence intervals were taken into account in determining the direction of the comparison.
Trend
This comparison measures the indicator’s values over multiple time periods.<br>The Mann-Kendall Test for Statistical Significance is used to evaluate the trend<br>over 4 to 10 periods of measure, subject to data availability and comparability.
State: Hawaii Adults with a Usual Source of Health Care
State: Hawaii Adults with a Usual Source of Health Care
88.4%
(2022)
Compared to:
Median Value for States and Territories
(76.8%)
The regional value is compared to the median value for states and territories.
Prior Value
(90.1%)
Prior Value compares a measured value with the previously measured value. Confidence intervals were taken into account in determining the direction of the comparison.
Trend
This comparison measures the indicator’s values over multiple time periods.<br>The Mann-Kendall Test for Statistical Significance is used to evaluate the trend<br>over 4 to 10 periods of measure, subject to data availability and comparability.
State: Hawaii Adults with Health Insurance: 18+
State: Hawaii Adults with Health Insurance: 18+
90.4%
(2023)
Compared to:
U.S. States
The distribution is based on data from 50 U.S. states and the District of Columbia.
US Value
(85.9%)
The regional value is compared to the national value.
Prior Value
(93.9%)
Prior Value compares a measured value with the previously measured value. Confidence intervals were not taken into account in determining the direction of the comparison.
Trend
This comparison measures the indicator’s values over multiple time periods.<br>The Mann-Kendall Test for Statistical Significance is used to evaluate the trend<br>over 4 to 10 periods of measure, subject to data availability and comparability.
State: Hawaii Adults with HMO Health Insurance
State: Hawaii Adults with HMO Health Insurance
17.0%
(2023)
Compared to:
US Value
(14.2%)
The regional value is compared to the national value.
Prior Value
(17.0%)
Prior Value compares a measured value with the previously measured value. Confidence intervals were not taken into account in determining the direction of the comparison.
State: Hawaii Adults with Medicaid Health Insurance
State: Hawaii Adults with Medicaid Health Insurance
8.7%
(2023)
Compared to:
US Value
(11.9%)
The regional value is compared to the national value.
Prior Value
(8.1%)
Prior Value compares a measured value with the previously measured value. Confidence intervals were not taken into account in determining the direction of the comparison.
Trend
This comparison measures the indicator’s values over multiple time periods.<br>The Mann-Kendall Test for Statistical Significance is used to evaluate the trend<br>over 4 to 10 periods of measure, subject to data availability and comparability.
State: Hawaii Adults with Medicare Health Insurance
State: Hawaii Adults with Medicare Health Insurance
20.4%
(2023)
Compared to:

US Value
(18.6%)
The regional value is compared to the national value.
Prior Value
(21.7%)
Prior Value compares a measured value with the previously measured value. Confidence intervals were not taken into account in determining the direction of the comparison.
Trend
This comparison measures the indicator’s values over multiple time periods.<br>The Mann-Kendall Test for Statistical Significance is used to evaluate the trend<br>over 4 to 10 periods of measure, subject to data availability and comparability.
State: Hawaii Adults with Military Health Insurance
State: Hawaii Adults with Military Health Insurance
4.4%
(2023)
Compared to:
US Value
(4.6%)
The regional value is compared to the national value.
Prior Value
(4.7%)
Prior Value compares a measured value with the previously measured value. Confidence intervals were not taken into account in determining the direction of the comparison.
Trend
This comparison measures the indicator’s values over multiple time periods.<br>The Mann-Kendall Test for Statistical Significance is used to evaluate the trend<br>over 4 to 10 periods of measure, subject to data availability and comparability.
State: Hawaii Adults with Other Health Insurance
State: Hawaii Adults with Other Health Insurance
5.7%
(2023)
Compared to:

US Value
(6.2%)
The regional value is compared to the national value.
Prior Value
(5.9%)
Prior Value compares a measured value with the previously measured value. Confidence intervals were not taken into account in determining the direction of the comparison.
Trend
This comparison measures the indicator’s values over multiple time periods.<br>The Mann-Kendall Test for Statistical Significance is used to evaluate the trend<br>over 4 to 10 periods of measure, subject to data availability and comparability.
State: Hawaii Adults with POS Health Insurance
State: Hawaii Adults with POS Health Insurance
2.1%
(2023)
Compared to:
US Value
(1.9%)
The regional value is compared to the national value.
Prior Value
(2.2%)
Prior Value compares a measured value with the previously measured value. Confidence intervals were not taken into account in determining the direction of the comparison.
Trend
This comparison measures the indicator’s values over multiple time periods.<br>The Mann-Kendall Test for Statistical Significance is used to evaluate the trend<br>over 4 to 10 periods of measure, subject to data availability and comparability.
State: Hawaii Adults with PPO Health Insurance
State: Hawaii Adults with PPO Health Insurance
36.1%
(2023)
Compared to:
US Value
(33.9%)
The regional value is compared to the national value.
Prior Value
(36.9%)
Prior Value compares a measured value with the previously measured value. Confidence intervals were not taken into account in determining the direction of the comparison.
Trend
This comparison measures the indicator’s values over multiple time periods.<br>The Mann-Kendall Test for Statistical Significance is used to evaluate the trend<br>over 4 to 10 periods of measure, subject to data availability and comparability.
State: Hawaii Adults without Health Insurance
State: Hawaii Adults without Health Insurance
2.9%
(2022)
Compared to:
Median Value for States and Territories
(7.1%)
The regional value is compared to the median value for states and territories.
Prior Value
(3.5%)
Prior Value compares a measured value with the previously measured value. Confidence intervals were taken into account in determining the direction of the comparison.
Trend
This comparison measures the indicator’s values over multiple time periods.<br>The Mann-Kendall Test for Statistical Significance is used to evaluate the trend<br>over 4 to 10 periods of measure, subject to data availability and comparability.
State: Hawaii All-Cause Hospitalization Rate
State: Hawaii All-Cause Hospitalization Rate
754.8
Hospitalizations per 10,000 population
(2018-2022)
Compared to:
Prior Value
(754.8)
Prior Value compares a measured value with the previously measured value. Confidence intervals were taken into account in determining the direction of the comparison.
Trend
This comparison measures the indicator’s values over multiple time periods.<br>The Mann-Kendall Test for Statistical Significance is used to evaluate the trend<br>over 4 to 10 periods of measure, subject to data availability and comparability.
State: Hawaii Children with Access to a Medical Home
State: Hawaii Children with Access to a Medical Home
47.9%
(2020-2021)
Compared to:
US Value
(46.6%)
The regional value is compared to the national value.
Prior Value
(47.9%)
Prior Value compares a measured value with the previously measured value. Confidence intervals were taken into account in determining the direction of the comparison.
Trend
This comparison measures the indicator’s values over multiple time periods.<br>The Mann-Kendall Test for Statistical Significance is used to evaluate the trend<br>over 4 to 10 periods of measure, subject to data availability and comparability.
HP 2030 Target
(53.6%)
<div>
<div>MICH-19: Increase the proportion of children and adolescents who receive care in a medical home</div>
<div> </div>
<div>The national indicator definition and data source are the same as for the state.</div>
</div>
State: Hawaii Children with an Ongoing Source of Care
State: Hawaii Children with an Ongoing Source of Care
74.4%
(2020-2021)
Compared to:
US Value
(70.8%)
The regional value is compared to the national value.
Prior Value
(74.8%)
Prior Value compares a measured value with the previously measured value. Confidence intervals were taken into account in determining the direction of the comparison.
Trend
This comparison measures the indicator’s values over multiple time periods.<br>The Mann-Kendall Test for Statistical Significance is used to evaluate the trend<br>over 4 to 10 periods of measure, subject to data availability and comparability.
State: Hawaii Children without Health Insurance
State: Hawaii Children without Health Insurance
2.7%
(2016-2020)
Compared to:
US Value
(5.2%)
The regional value is compared to the national value.
Prior Value
(2.3%)
Prior Value compares a measured value with the previously measured value. Confidence intervals were taken into account in determining the direction of the comparison.
Trend
This comparison measures the indicator’s values over multiple time periods.<br>The Mann-Kendall Test for Statistical Significance is used to evaluate the trend<br>over 4 to 10 periods of measure, subject to data availability and comparability.
State: Hawaii Community Spending on Health Care
State: Hawaii Community Spending on Health Care
7.6%
(2023)
Compared to:
US Value
(8.0%)
The regional value is compared to the national value.
Prior Value
(7.6%)
Prior Value compares a measured value with the previously measured value. Confidence intervals were not taken into account in determining the direction of the comparison.
State: Hawaii Dental Hygienist Rate
State: Hawaii Dental Hygienist Rate
68.7
Per 100,000 population
(2020-2021)
Compared to:
Prior Value
(66.7)
Prior Value compares a measured value with the previously measured value. Confidence intervals were not taken into account in determining the direction of the comparison.
State: Hawaii Doctors of Osteopathy Primary Care Provider Rate
State: Hawaii Doctors of Osteopathy Primary Care Provider Rate
5.1
Per 100,000 population
(2020-2021)
Compared to:
Prior Value
(5.2)
Prior Value compares a measured value with the previously measured value. Confidence intervals were not taken into account in determining the direction of the comparison.
Trend
This comparison measures the indicator’s values over multiple time periods.<br>The Mann-Kendall Test for Statistical Significance is used to evaluate the trend<br>over 4 to 10 periods of measure, subject to data availability and comparability.
State: Hawaii Health Insurance Spending-to-Income Ratio
State: Hawaii Health Insurance Spending-to-Income Ratio
5.5%
(2023)
Compared to:
U.S. States
The distribution is based on data from 50 U.S. states and the District of Columbia.
Prior Value
(5.4%)
Prior Value compares a measured value with the previously measured value. Confidence intervals were not taken into account in determining the direction of the comparison.
State: Hawaii Households that Received Cardiology Medical Services
State: Hawaii Households that Received Cardiology Medical Services
12.6%
(2023)
Compared to:
US Value
(11.8%)
The regional value is compared to the national value.
Prior Value
(12.3%)
Prior Value compares a measured value with the previously measured value. Confidence intervals were not taken into account in determining the direction of the comparison.
Trend
This comparison measures the indicator’s values over multiple time periods.<br>The Mann-Kendall Test for Statistical Significance is used to evaluate the trend<br>over 4 to 10 periods of measure, subject to data availability and comparability.
State: Hawaii Households that Received Maternity Care Services
State: Hawaii Households that Received Maternity Care Services
5.3%
(2023)
Compared to:
US Value
(5.8%)
The regional value is compared to the national value.
Prior Value
(5.3%)
Prior Value compares a measured value with the previously measured value. Confidence intervals were not taken into account in determining the direction of the comparison.
Trend
This comparison measures the indicator’s values over multiple time periods.<br>The Mann-Kendall Test for Statistical Significance is used to evaluate the trend<br>over 4 to 10 periods of measure, subject to data availability and comparability.
27.4%
(2023)
Compared to:
US Value
(28.0%)
The regional value is compared to the national value.
Prior Value
(27.8%)
Prior Value compares a measured value with the previously measured value. Confidence intervals were not taken into account in determining the direction of the comparison.
Trend
This comparison measures the indicator’s values over multiple time periods.<br>The Mann-Kendall Test for Statistical Significance is used to evaluate the trend<br>over 4 to 10 periods of measure, subject to data availability and comparability.
27.1%
(2023)
Compared to:
US Value
(25.9%)
The regional value is compared to the national value.
Prior Value
(26.3%)
Prior Value compares a measured value with the previously measured value. Confidence intervals were not taken into account in determining the direction of the comparison.
Trend
This comparison measures the indicator’s values over multiple time periods.<br>The Mann-Kendall Test for Statistical Significance is used to evaluate the trend<br>over 4 to 10 periods of measure, subject to data availability and comparability.
State: Hawaii Households that Received Pediatric Medical Services
State: Hawaii Households that Received Pediatric Medical Services
10.0%
(2023)
Compared to:
US Value
(10.8%)
The regional value is compared to the national value.
Prior Value
(9.6%)
Prior Value compares a measured value with the previously measured value. Confidence intervals were not taken into account in determining the direction of the comparison.
Trend
This comparison measures the indicator’s values over multiple time periods.<br>The Mann-Kendall Test for Statistical Significance is used to evaluate the trend<br>over 4 to 10 periods of measure, subject to data availability and comparability.
State: Hawaii Medicare Healthcare Costs
State: Hawaii Medicare Healthcare Costs
$7,190
Dollars per enrollee
(2015)
Compared to:
US Value
($9,729)
The regional value is compared to the national value.
Prior Value
($7,183)
Prior Value compares a measured value with the previously measured value. Confidence intervals were not taken into account in determining the direction of the comparison.
Trend
This comparison measures the indicator’s values over multiple time periods.<br>The Mann-Kendall Test for Statistical Significance is used to evaluate the trend<br>over 4 to 10 periods of measure, subject to data availability and comparability.
State: Hawaii Non-Physician Primary Care Provider Rate
State: Hawaii Non-Physician Primary Care Provider Rate
82
Providers per 100,000 population
(2023)
Compared to:

U.S. States
The distribution is based on data from 50 U.S. states and the District of Columbia.
Prior Value
(77)
Prior Value compares a measured value with the previously measured value. Confidence intervals were not taken into account in determining the direction of the comparison.
Trend
This comparison measures the indicator’s values over multiple time periods.<br>The Mann-Kendall Test for Statistical Significance is used to evaluate the trend<br>over 4 to 10 periods of measure, subject to data availability and comparability.
State: Hawaii Number of Practicing Physician Assistants
State: Hawaii Number of Practicing Physician Assistants
24.8
Per 100,000 population
(2020-2021)
Compared to:
Prior Value
(27.0)
Prior Value compares a measured value with the previously measured value. Confidence intervals were not taken into account in determining the direction of the comparison.
Trend
This comparison measures the indicator’s values over multiple time periods.<br>The Mann-Kendall Test for Statistical Significance is used to evaluate the trend<br>over 4 to 10 periods of measure, subject to data availability and comparability.
State: Hawaii Nurse Practitioner Rate
State: Hawaii Nurse Practitioner Rate
65.1
Per 100,000 population
(2019-2020)
Compared to:
Prior Value
(63.6)
Prior Value compares a measured value with the previously measured value. Confidence intervals were not taken into account in determining the direction of the comparison.
Trend
This comparison measures the indicator’s values over multiple time periods.<br>The Mann-Kendall Test for Statistical Significance is used to evaluate the trend<br>over 4 to 10 periods of measure, subject to data availability and comparability.
State: Hawaii Persons with Health Insurance
State: Hawaii Persons with Health Insurance
95.6%
(2021)
Compared to:

U.S. States
The distribution is based on data from 50 U.S. states and the District of Columbia.
Prior Value
(95.3%)
Prior Value compares a measured value with the previously measured value. Confidence intervals were taken into account in determining the direction of the comparison.
Trend
This comparison measures the indicator’s values over multiple time periods.<br>The Mann-Kendall Test for Statistical Significance is used to evaluate the trend<br>over 4 to 10 periods of measure, subject to data availability and comparability.
HP 2030 LHI
(92.4%)
<div>
<div>AHS-01: Increase the proportion of people with health insurance <strong>(LEADING HEALTH INDICATOR)</strong></div>
<div> </div>
<div>The national indicator is defined in exactly the same way. The data source for the national indicator is the National Health Interview Survey, from which state-level data for Hawaiʻi cannot be obtained. The state data source is the US Census Bureau- Small Area Health Insurance Estimates.</div>
</div>
State: Hawaii Persons with Private Health Insurance Only
State: Hawaii Persons with Private Health Insurance Only
57.1%
(2022)
Compared to:
US Value
(54.8%)
The regional value is compared to the national value.
Prior Value
(56.3%)
Prior Value compares a measured value with the previously measured value. Confidence intervals were not taken into account in determining the direction of the comparison.
Trend
This comparison measures the indicator’s values over multiple time periods.<br>The Mann-Kendall Test for Statistical Significance is used to evaluate the trend<br>over 4 to 10 periods of measure, subject to data availability and comparability.
State: Hawaii Persons with Public Health Insurance Only
State: Hawaii Persons with Public Health Insurance Only
21.4%
(2022)
Compared to:
US Value
(24.8%)
The regional value is compared to the national value.
Prior Value
(21.6%)
Prior Value compares a measured value with the previously measured value. Confidence intervals were not taken into account in determining the direction of the comparison.
Trend
This comparison measures the indicator’s values over multiple time periods.<br>The Mann-Kendall Test for Statistical Significance is used to evaluate the trend<br>over 4 to 10 periods of measure, subject to data availability and comparability.
State: Hawaii Persons without Health Insurance
State: Hawaii Persons without Health Insurance
4.1%
(2014-2018)
Compared to:
US Value
(9.4%)
The regional value is compared to the national value.
Trend
This comparison measures the indicator’s values over multiple time periods.<br>The Mann-Kendall Test for Statistical Significance is used to evaluate the trend<br>over 4 to 10 periods of measure, subject to data availability and comparability.
State: Hawaii Preventable Hospital Stays: Medicare Population
State: Hawaii Preventable Hospital Stays: Medicare Population
1,581.0
Discharges per 100,000 Medicare enrollees
(2022)
Compared to:
U.S. States
The distribution is based on data from 50 U.S. states and the District of Columbia.
US Value
(2,677.0)
The regional value is compared to the national value.
Prior Value
(1,545.0)
Prior Value compares a measured value with the previously measured value. Confidence intervals were not taken into account in determining the direction of the comparison.
Trend
This comparison measures the indicator’s values over multiple time periods.<br>The Mann-Kendall Test for Statistical Significance is used to evaluate the trend<br>over 4 to 10 periods of measure, subject to data availability and comparability.
State: Hawaii Primary Care Provider Rate
State: Hawaii Primary Care Provider Rate
89
Providers per 100,000 population
(2021)
Compared to:
U.S. States
The distribution is based on data from 50 U.S. states and the District of Columbia.
Prior Value
(93)
Prior Value compares a measured value with the previously measured value. Confidence intervals were not taken into account in determining the direction of the comparison.
Trend
This comparison measures the indicator’s values over multiple time periods.<br>The Mann-Kendall Test for Statistical Significance is used to evaluate the trend<br>over 4 to 10 periods of measure, subject to data availability and comparability.
State: Hawaii Teens Who Had a Physical in the Past Year
State: Hawaii Teens Who Had a Physical in the Past Year
73.2%
(2021)
Compared to:
Prior Value
(74.5%)
Prior Value compares a measured value with the previously measured value. Confidence intervals were taken into account in determining the direction of the comparison.
Trend
This comparison measures the indicator’s values over multiple time periods.<br>The Mann-Kendall Test for Statistical Significance is used to evaluate the trend<br>over 4 to 10 periods of measure, subject to data availability and comparability.
HP 2030 Target
(82.6%)
<div><span>AH-01: Increase the proportion of adolescents who had a preventive health care visit in the past year<br /> <br />The national indicator includes adolescents aged 12-17. The data source for the national indicator is the National Survey of Children's Health. The state data source is the Youth Risk Behavior Survey, which is comparable to the national data source. It is divided into two groups: grades 6-8 and grades 9-12. This indicator reports data for students in grades 9-12, while the indicator 'Young Teens Who Had a Physical in the Past Year' reports for those in grades 6-8.</span></div>
State: Hawaii Young Teens Who Had a Physical in the Past Year
State: Hawaii Young Teens Who Had a Physical in the Past Year
70.2%
(2017)
Compared to:
Prior Value
(65.9%)
Prior Value compares a measured value with the previously measured value. Confidence intervals were taken into account in determining the direction of the comparison.
HP 2030 Target
(82.6%)
<div><span>AH-01: Increase the proportion of adolescents who had a preventive health care visit in the past year<br /> <br />The national indicator includes adolescents aged 12-17. The data source for the national indicator is the National Survey of Children's Health. The state data source is the Youth Risk Behavior Survey, which is comparable to the national data source. It is divided into two groups: grades 6-8 and grades 9-12. This indicator reports data for students in grades 6-8, while the indicator 'Teens Who Had a Physical in the Past Year' reports for those in grades 9-12.</span></div>
State: Hawaii
Health / Health Information Technology
Value
Compared to:
35.2%
(2023)
Compared to:
US Value
(31.8%)
The regional value is compared to the national value.
Prior Value
(35.5%)
Prior Value compares a measured value with the previously measured value. Confidence intervals were not taken into account in determining the direction of the comparison.
State: Hawaii Adults with Internet Access
State: Hawaii Adults with Internet Access
95.0%
(2023)
Compared to:
U.S. States
The distribution is based on data from 50 U.S. states and the District of Columbia.
US Value
(91.7%)
The regional value is compared to the national value.
Prior Value
(96.6%)
Prior Value compares a measured value with the previously measured value. Confidence intervals were not taken into account in determining the direction of the comparison.
Trend
This comparison measures the indicator’s values over multiple time periods.<br>The Mann-Kendall Test for Statistical Significance is used to evaluate the trend<br>over 4 to 10 periods of measure, subject to data availability and comparability.
State: Hawaii Households with a Computer
State: Hawaii Households with a Computer
90.5%
(2023)
Compared to:
U.S. States
The distribution is based on data from 50 U.S. states and the District of Columbia.
US Value
(88.2%)
The regional value is compared to the national value.
Prior Value
(90.4%)
Prior Value compares a measured value with the previously measured value. Confidence intervals were not taken into account in determining the direction of the comparison.
Trend
This comparison measures the indicator’s values over multiple time periods.<br>The Mann-Kendall Test for Statistical Significance is used to evaluate the trend<br>over 4 to 10 periods of measure, subject to data availability and comparability.
State: Hawaii Households with a Smartphone
State: Hawaii Households with a Smartphone
86.2%
(2023)
Compared to:
U.S. States
The distribution is based on data from 50 U.S. states and the District of Columbia.
US Value
(84.7%)
The regional value is compared to the national value.
Prior Value
(84.9%)
Prior Value compares a measured value with the previously measured value. Confidence intervals were not taken into account in determining the direction of the comparison.
Trend
This comparison measures the indicator’s values over multiple time periods.<br>The Mann-Kendall Test for Statistical Significance is used to evaluate the trend<br>over 4 to 10 periods of measure, subject to data availability and comparability.
State: Hawaii Households with an Internet Subscription
State: Hawaii Households with an Internet Subscription
90.0%
(2018-2022)
Compared to:
U.S. States
The distribution is based on data from 50 U.S. states and the District of Columbia.
US Value
(88.5%)
The regional value is compared to the national value.
Trend
This comparison measures the indicator’s values over multiple time periods.<br>The Mann-Kendall Test for Statistical Significance is used to evaluate the trend<br>over 4 to 10 periods of measure, subject to data availability and comparability.
State: Hawaii Households with One or More Types of Computing Devices
State: Hawaii Households with One or More Types of Computing Devices
94.5%
(2018-2022)
Compared to:
U.S. States
The distribution is based on data from 50 U.S. states and the District of Columbia.
US Value
(94.0%)
The regional value is compared to the national value.
Trend
This comparison measures the indicator’s values over multiple time periods.<br>The Mann-Kendall Test for Statistical Significance is used to evaluate the trend<br>over 4 to 10 periods of measure, subject to data availability and comparability.
State: Hawaii Persons with an Internet Subscription
State: Hawaii Persons with an Internet Subscription
92.6%
(2018-2022)
Compared to:
U.S. States
The distribution is based on data from 50 U.S. states and the District of Columbia.
US Value
(91.0%)
The regional value is compared to the national value.
Trend
This comparison measures the indicator’s values over multiple time periods.<br>The Mann-Kendall Test for Statistical Significance is used to evaluate the trend<br>over 4 to 10 periods of measure, subject to data availability and comparability.
State: Hawaii
Health / Heart Disease & Stroke
Value
Compared to:
State: Hawaii Adults Who Bought Medications for Cholesterol
State: Hawaii Adults Who Bought Medications for Cholesterol
18.3%
(2023)
Compared to:
US Value
(17.1%)
The regional value is compared to the national value.
Prior Value
(18.4%)
Prior Value compares a measured value with the previously measured value. Confidence intervals were not taken into account in determining the direction of the comparison.
Trend
This comparison measures the indicator’s values over multiple time periods.<br>The Mann-Kendall Test for Statistical Significance is used to evaluate the trend<br>over 4 to 10 periods of measure, subject to data availability and comparability.
State: Hawaii Adults Who Bought Medications for High Blood Pressure
State: Hawaii Adults Who Bought Medications for High Blood Pressure
24.5%
(2023)
Compared to:
US Value
(24.4%)
The regional value is compared to the national value.
Prior Value
(24.5%)
Prior Value compares a measured value with the previously measured value. Confidence intervals were not taken into account in determining the direction of the comparison.
Trend
This comparison measures the indicator’s values over multiple time periods.<br>The Mann-Kendall Test for Statistical Significance is used to evaluate the trend<br>over 4 to 10 periods of measure, subject to data availability and comparability.
State: Hawaii Adults Who Experienced a Heart Attack
State: Hawaii Adults Who Experienced a Heart Attack
3.5%
(2022)
Compared to:
Median Value for States and Territories
(4.5%)
The regional value is compared to the median value for states and territories.
Prior Value
(2.9%)
Prior Value compares a measured value with the previously measured value. Confidence intervals were taken into account in determining the direction of the comparison.
Trend
This comparison measures the indicator’s values over multiple time periods.<br>The Mann-Kendall Test for Statistical Significance is used to evaluate the trend<br>over 4 to 10 periods of measure, subject to data availability and comparability.
State: Hawaii Adults who Experienced a Stroke
State: Hawaii Adults who Experienced a Stroke
2.8%
(2022)
Compared to:
Median Value for States and Territories
(3.4%)
The regional value is compared to the median value for states and territories.
Prior Value
(3.0%)
Prior Value compares a measured value with the previously measured value. Confidence intervals were taken into account in determining the direction of the comparison.
Trend
This comparison measures the indicator’s values over multiple time periods.<br>The Mann-Kendall Test for Statistical Significance is used to evaluate the trend<br>over 4 to 10 periods of measure, subject to data availability and comparability.
State: Hawaii Adults who Experienced Coronary Heart Disease
State: Hawaii Adults who Experienced Coronary Heart Disease
3.4%
(2022)
Compared to:
Median Value for States and Territories
(4.4%)
The regional value is compared to the median value for states and territories.
Prior Value
(2.6%)
Prior Value compares a measured value with the previously measured value. Confidence intervals were taken into account in determining the direction of the comparison.
Trend
This comparison measures the indicator’s values over multiple time periods.<br>The Mann-Kendall Test for Statistical Significance is used to evaluate the trend<br>over 4 to 10 periods of measure, subject to data availability and comparability.
79.5%
(2021)
Compared to:
Prior Value
(74.4%)
Prior Value compares a measured value with the previously measured value. Confidence intervals were taken into account in determining the direction of the comparison.
Trend
This comparison measures the indicator’s values over multiple time periods.<br>The Mann-Kendall Test for Statistical Significance is used to evaluate the trend<br>over 4 to 10 periods of measure, subject to data availability and comparability.
HDS Plan Target
(82.6%)
State: Hawaii Adults Who Visited a Cardiologist
State: Hawaii Adults Who Visited a Cardiologist
14.9%
(2023)
Compared to:
US Value
(13.2%)
The regional value is compared to the national value.
Prior Value
(14.2%)
Prior Value compares a measured value with the previously measured value. Confidence intervals were not taken into account in determining the direction of the comparison.
Trend
This comparison measures the indicator’s values over multiple time periods.<br>The Mann-Kendall Test for Statistical Significance is used to evaluate the trend<br>over 4 to 10 periods of measure, subject to data availability and comparability.
State: Hawaii Adults with a Cholesterol Test, past 5 years
State: Hawaii Adults with a Cholesterol Test, past 5 years
82.7%
(2021)
Compared to:
Median Value for States and Territories
(85.3%)
The regional value is compared to the median value for states and territories.
Prior Value
(85.1%)
Prior Value compares a measured value with the previously measured value. Confidence intervals were taken into account in determining the direction of the comparison.
Trend
This comparison measures the indicator’s values over multiple time periods.<br>The Mann-Kendall Test for Statistical Significance is used to evaluate the trend<br>over 4 to 10 periods of measure, subject to data availability and comparability.
State: Hawaii Adults with High Blood Cholesterol
State: Hawaii Adults with High Blood Cholesterol
34.9%
(2021)
Compared to:
Median Value for States and Territories
(35.6%)
The regional value is compared to the median value for states and territories.
Prior Value
(29.9%)
Prior Value compares a measured value with the previously measured value. Confidence intervals were taken into account in determining the direction of the comparison.
Trend
This comparison measures the indicator’s values over multiple time periods.<br>The Mann-Kendall Test for Statistical Significance is used to evaluate the trend<br>over 4 to 10 periods of measure, subject to data availability and comparability.
State: Hawaii Adults with High Blood Pressure
State: Hawaii Adults with High Blood Pressure
29.8%
(2021)
Compared to:
Median Value for States and Territories
(11.1%)
The regional value is compared to the median value for states and territories.
Prior Value
(30.7%)
Prior Value compares a measured value with the previously measured value. Confidence intervals were taken into account in determining the direction of the comparison.
Trend
This comparison measures the indicator’s values over multiple time periods.<br>The Mann-Kendall Test for Statistical Significance is used to evaluate the trend<br>over 4 to 10 periods of measure, subject to data availability and comparability.
HP 2030 Target
(42.6%)
<div>HDS-04: Reduce the proportion of adults with high blood pressure<br /> <br />The national indicator excludes pregnant women. The data source for the national indicator is the National Health and Nutrition Examination Survey, which is not conducted in Hawaii. The state data source is the Behavioral Risk Factor Surveillance System, which is self-reported but comparable to the national data source.</div>
State: Hawaii Adults with Hypertension with Controlled Blood Pressure
State: Hawaii Adults with Hypertension with Controlled Blood Pressure
55.9%
(2021)
Compared to:
US Value
(63.8% in 2015)
The regional value is compared to the national value.
Prior Value
(58.4%)
Prior Value compares a measured value with the previously measured value. Confidence intervals were not taken into account in determining the direction of the comparison.
Trend
This comparison measures the indicator’s values over multiple time periods.<br>The Mann-Kendall Test for Statistical Significance is used to evaluate the trend<br>over 4 to 10 periods of measure, subject to data availability and comparability.
HDS Plan Target
(64.2%)
HP 2030 LHI
(18.9%)
<div><span>HDS-05: Increase control of high blood pressure in adults <strong>(LEADING HEALTH INDICATOR)</strong><br /> <br />The national indicator is defined in exactly the same way. The data source for the national indicator is the National Health and Nutrition Examination Survey, which is not conducted in Hawaiʻi. The state data source is the Uniform Data System from Federally Qualified Health Centers which is collected comparably to the national data source.</span></div>
State: Hawaii Atrial Fibrillation: Medicare Population
State: Hawaii Atrial Fibrillation: Medicare Population
11.0%
(2022)
Compared to:
U.S. States
The distribution is based on data from 50 U.S. states and the District of Columbia.
US Value
(14.0%)
The regional value is compared to the national value.
Prior Value
(11.0%)
Prior Value compares a measured value with the previously measured value. Confidence intervals were not taken into account in determining the direction of the comparison.
Trend
This comparison measures the indicator’s values over multiple time periods.<br>The Mann-Kendall Test for Statistical Significance is used to evaluate the trend<br>over 4 to 10 periods of measure, subject to data availability and comparability.
State: Hawaii Congestive Heart Failure Death Rate
State: Hawaii Congestive Heart Failure Death Rate
8.2
Deaths per 100,000 population
(2022)
Compared to:
US Value
(21.6 in 2021)
The regional value is compared to the national value.
Prior Value
(9.5)
Prior Value compares a measured value with the previously measured value. Confidence intervals were taken into account in determining the direction of the comparison.
Trend
This comparison measures the indicator’s values over multiple time periods.<br>The Mann-Kendall Test for Statistical Significance is used to evaluate the trend<br>over 4 to 10 periods of measure, subject to data availability and comparability.
State: Hawaii Coronary Heart Disease Death Rate
State: Hawaii Coronary Heart Disease Death Rate
66.4
Deaths per 100,000 population
(2022)
Compared to:
US Value
(92.8 in 2021)
The regional value is compared to the national value.
Prior Value
(63.5)
Prior Value compares a measured value with the previously measured value. Confidence intervals were taken into account in determining the direction of the comparison.
Trend
This comparison measures the indicator’s values over multiple time periods.<br>The Mann-Kendall Test for Statistical Significance is used to evaluate the trend<br>over 4 to 10 periods of measure, subject to data availability and comparability.
HDS Plan Target
(54.3)
HP 2030 Target
(71.1)
<div><span>HDS-02: Reduce coronary heart disease deaths<br /><br />The national indicator definition and data source are the same as for the state.</span></div>
State: Hawaii Diseases of the Heart Death Rate
State: Hawaii Diseases of the Heart Death Rate
124.1
Deaths per 100,000 population
(2022)
Compared to:
US Value
(173.8 in 2021)
The regional value is compared to the national value.
Prior Value
(119.8)
Prior Value compares a measured value with the previously measured value. Confidence intervals were taken into account in determining the direction of the comparison.
Trend
This comparison measures the indicator’s values over multiple time periods.<br>The Mann-Kendall Test for Statistical Significance is used to evaluate the trend<br>over 4 to 10 periods of measure, subject to data availability and comparability.
State: Hawaii Heart Failure: Medicare Population
State: Hawaii Heart Failure: Medicare Population
8.0%
(2022)
Compared to:
U.S. States
The distribution is based on data from 50 U.S. states and the District of Columbia.
US Value
(11.0%)
The regional value is compared to the national value.
Prior Value
(8.0%)
Prior Value compares a measured value with the previously measured value. Confidence intervals were not taken into account in determining the direction of the comparison.
Trend
This comparison measures the indicator’s values over multiple time periods.<br>The Mann-Kendall Test for Statistical Significance is used to evaluate the trend<br>over 4 to 10 periods of measure, subject to data availability and comparability.
70.8%
(2021)
Compared to:
US Value
(73.1%)
The regional value is compared to the national value.
Prior Value
(70.1%)
Prior Value compares a measured value with the previously measured value. Confidence intervals were not taken into account in determining the direction of the comparison.
HDS Plan Target
(77.1%)
State: Hawaii Hyperlipidemia: Medicare Population
State: Hawaii Hyperlipidemia: Medicare Population
70.0%
(2022)
Compared to:
U.S. States
The distribution is based on data from 50 U.S. states and the District of Columbia.
US Value
(65.0%)
The regional value is compared to the national value.
Prior Value
(68.0%)
Prior Value compares a measured value with the previously measured value. Confidence intervals were not taken into account in determining the direction of the comparison.
Trend
This comparison measures the indicator’s values over multiple time periods.<br>The Mann-Kendall Test for Statistical Significance is used to evaluate the trend<br>over 4 to 10 periods of measure, subject to data availability and comparability.
State: Hawaii Hypertension: Medicare Population
State: Hawaii Hypertension: Medicare Population
63.0%
(2022)
Compared to:
U.S. States
The distribution is based on data from 50 U.S. states and the District of Columbia.
US Value
(65.0%)
The regional value is compared to the national value.
Prior Value
(63.0%)
Prior Value compares a measured value with the previously measured value. Confidence intervals were not taken into account in determining the direction of the comparison.
Trend
This comparison measures the indicator’s values over multiple time periods.<br>The Mann-Kendall Test for Statistical Significance is used to evaluate the trend<br>over 4 to 10 periods of measure, subject to data availability and comparability.
State: Hawaii Ischemic Heart Disease: Medicare Population
State: Hawaii Ischemic Heart Disease: Medicare Population
14.0%
(2022)
Compared to:
U.S. States
The distribution is based on data from 50 U.S. states and the District of Columbia.
US Value
(21.0%)
The regional value is compared to the national value.
Prior Value
(14.0%)
Prior Value compares a measured value with the previously measured value. Confidence intervals were not taken into account in determining the direction of the comparison.
Trend
This comparison measures the indicator’s values over multiple time periods.<br>The Mann-Kendall Test for Statistical Significance is used to evaluate the trend<br>over 4 to 10 periods of measure, subject to data availability and comparability.
State: Hawaii Stroke Death Rate
State: Hawaii Stroke Death Rate
38.6
Deaths per 100,000 population
(2022)
Compared to:
US Value
(41.1 in 2021)
The regional value is compared to the national value.
Prior Value
(41.2)
Prior Value compares a measured value with the previously measured value. Confidence intervals were taken into account in determining the direction of the comparison.
Trend
This comparison measures the indicator’s values over multiple time periods.<br>The Mann-Kendall Test for Statistical Significance is used to evaluate the trend<br>over 4 to 10 periods of measure, subject to data availability and comparability.
HDS Plan Target
(33.4)
HP 2030 Target
(33.4)
<div><span>HDS-03: Reduce stroke deaths </span></div>
<div><span></span></div>
<div><span>The national indicator definition and data source are the same as for the state</span></div>
State: Hawaii Stroke: Medicare Population
State: Hawaii Stroke: Medicare Population
5.0%
(2022)
Compared to:

U.S. States
The distribution is based on data from 50 U.S. states and the District of Columbia.
US Value
(6.0%)
The regional value is compared to the national value.
Prior Value
(6.0%)
Prior Value compares a measured value with the previously measured value. Confidence intervals were not taken into account in determining the direction of the comparison.
Trend
This comparison measures the indicator’s values over multiple time periods.<br>The Mann-Kendall Test for Statistical Significance is used to evaluate the trend<br>over 4 to 10 periods of measure, subject to data availability and comparability.
State: Hawaii
Health / Immunizations & Infectious Diseases
Value
Compared to:
State: Hawaii Acute Hepatitis B Incidence Rate
State: Hawaii Acute Hepatitis B Incidence Rate
0.0
Cases per 100,000 population
(2018-2022)
Compared to:
Prior Value
(0.0)
Prior Value compares a measured value with the previously measured value. Confidence intervals were not taken into account in determining the direction of the comparison.
Trend
This comparison measures the indicator’s values over multiple time periods.<br>The Mann-Kendall Test for Statistical Significance is used to evaluate the trend<br>over 4 to 10 periods of measure, subject to data availability and comparability.
Cancer Plan Target
(0.1)
HP 2030 Target
(0.1)
<div>IID-11: Reduce the rate of acute hepatitis B</div>
<div> </div>
<div>The national indicator definition and data source are the same as for the state.</div>
State: Hawaii Adolescents 13-15 with HPV Vaccines
State: Hawaii Adolescents 13-15 with HPV Vaccines
66.2%
(2021)
Compared to:
US Value
(58.5%)
The regional value is compared to the national value.
Prior Value
(69.5%)
Prior Value compares a measured value with the previously measured value. Confidence intervals were taken into account in determining the direction of the comparison.
Cancer Plan Target
(80.0%)
HP 2030 Target
(80.0%)
<div><span>IID-08: Increase the proportion of adolescents who get recommended doses of the HPV vaccine<br /><br />The national indicator definition and data source are the same as for the state.</span></div>
State: Hawaii Adult Influenza Vaccination Rate
State: Hawaii Adult Influenza Vaccination Rate
47.3%
(2021)
Compared to:
Prior Value
(46.8%)
Prior Value compares a measured value with the previously measured value. Confidence intervals were taken into account in determining the direction of the comparison.
HP 2030 LHI
(70.0%)
<div>
<div>IID-09: Increase the proportion of people who get the flu vaccine every year <strong>(LEADING HEALTH INDICATOR)</strong></div>
<div> </div>
<div>The national objective includes all persons 6 months and older. The data source for the national indicator is the National Health Interview Survey, which does not provide state-level data for Hawaiʻi. The state data sources are the National Immunization Survey for children 6 months to 17 years and the Behavioral Risk Factor Surveillance System for adults 18 years and older, which are comparable to the national source. </div>
</div>
State: Hawaii Adult Tetanus Vaccination
State: Hawaii Adult Tetanus Vaccination
60.2%
(2022)
Compared to:
Median Value for States and Territories
(71.3% in 2019)
The regional value is compared to the median value for states and territories.
Prior Value
(66.8%)
Prior Value compares a measured value with the previously measured value. Confidence intervals were taken into account in determining the direction of the comparison.
State: Hawaii Adults 18-26 with HPV Vaccines
State: Hawaii Adults 18-26 with HPV Vaccines
32.9%
(2022)
Compared to:
Prior Value
(37.4%)
Prior Value compares a measured value with the previously measured value. Confidence intervals were taken into account in determining the direction of the comparison.
Trend
This comparison measures the indicator’s values over multiple time periods.<br>The Mann-Kendall Test for Statistical Significance is used to evaluate the trend<br>over 4 to 10 periods of measure, subject to data availability and comparability.
Cancer Plan Target
(34.8%)
State: Hawaii Adults Tested for HIV in Past 2 Years
State: Hawaii Adults Tested for HIV in Past 2 Years
44.8%
(2022)
Compared to:
Prior Value
(50.0%)
Prior Value compares a measured value with the previously measured value. Confidence intervals were taken into account in determining the direction of the comparison.
Trend
This comparison measures the indicator’s values over multiple time periods.<br>The Mann-Kendall Test for Statistical Significance is used to evaluate the trend<br>over 4 to 10 periods of measure, subject to data availability and comparability.
State: Hawaii Children Aged 2 Years with 1 Dose of MMR Vaccine
State: Hawaii Children Aged 2 Years with 1 Dose of MMR Vaccine
83.6%
(2019)
Compared to:
US Value
(90.6%)
The regional value is compared to the national value.
Prior Value
(89.4%)
Prior Value compares a measured value with the previously measured value. Confidence intervals were taken into account in determining the direction of the comparison.
Trend
This comparison measures the indicator’s values over multiple time periods.<br>The Mann-Kendall Test for Statistical Significance is used to evaluate the trend<br>over 4 to 10 periods of measure, subject to data availability and comparability.
HP 2030 Target
(90.8%)
<div><span>IID-03: Maintain the vaccination coverage level of 1 dose of the MMR vaccine in children by age 2 years<br /><br />The national indicator definition and data source are the same as for the state. </span></div>
State: Hawaii Children Aged 2 Years with 4 Doses of DTaP Vaccine
State: Hawaii Children Aged 2 Years with 4 Doses of DTaP Vaccine
72.1%
(2019)
Compared to:
US Value
(81.4%)
The regional value is compared to the national value.
Prior Value
(83.4%)
Prior Value compares a measured value with the previously measured value. Confidence intervals were taken into account in determining the direction of the comparison.
Trend
This comparison measures the indicator’s values over multiple time periods.<br>The Mann-Kendall Test for Statistical Significance is used to evaluate the trend<br>over 4 to 10 periods of measure, subject to data availability and comparability.
HP 2030 Target
(90%)
<div><span>IID-06: Increase the coverage level of 4 doses of the DTaP vaccine in children by age 2 years<br /><br />The national indicator definition and data source are the same as for the state.</span></div>
State: Hawaii Children in Kindergarten with 2 Doses of MMR Vaccine
State: Hawaii Children in Kindergarten with 2 Doses of MMR Vaccine
94.3%
(2021-2022)
Compared to:
US Value
(93.0%)
The regional value is compared to the national value.
Prior Value
(92.9%)
Prior Value compares a measured value with the previously measured value. Confidence intervals were not taken into account in determining the direction of the comparison.
Trend
This comparison measures the indicator’s values over multiple time periods.<br>The Mann-Kendall Test for Statistical Significance is used to evaluate the trend<br>over 4 to 10 periods of measure, subject to data availability and comparability.
HP 2030 Target
(95%)
<div><span>IID-04: Maintain the vaccination coverage level of 2 doses of the MMR vaccine for children in kindergarten<br /><br />The national indicator definition and data source are the same as for the state. </span></div>
State: Hawaii Chlamydia Among Females
State: Hawaii Chlamydia Among Females
712.0
Cases per 100,000 females
(2019)
Compared to:
US Value
(627.2 in 2014)
The regional value is compared to the national value.
Prior Value
(676.2)
Prior Value compares a measured value with the previously measured value. Confidence intervals were not taken into account in determining the direction of the comparison.
Trend
This comparison measures the indicator’s values over multiple time periods.<br>The Mann-Kendall Test for Statistical Significance is used to evaluate the trend<br>over 4 to 10 periods of measure, subject to data availability and comparability.
8.5%
(2011)
Compared to:
Prior Value
(8.3%)
Prior Value compares a measured value with the previously measured value. Confidence intervals were not taken into account in determining the direction of the comparison.
State: Hawaii COVID-19 Daily Average Case-Fatality Rate
State: Hawaii COVID-19 Daily Average Case-Fatality Rate
1.7
Deaths per 100 cases
(Mar 3, 2023)
Compared to:
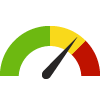
U.S. States
The distribution is based on data from 49 U.S. states and the District of Columbia.
US Value
(1.7)
The regional value is compared to the national value.
Prior Value
(3.8)
Prior Value compares a measured value with the previously measured value. Confidence intervals were not taken into account in determining the direction of the comparison.
Trend
This comparison measures the indicator’s values over multiple time periods.<br>The Mann-Kendall Test for Statistical Significance is used to evaluate the trend<br>over 4 to 10 periods of measure, subject to data availability and comparability.
State: Hawaii COVID-19 Daily Average Incidence Rate
State: Hawaii COVID-19 Daily Average Incidence Rate
7.46
Cases per 100,000 population
(Mar 3, 2023)
Compared to:
U.S. States
The distribution is based on data from 50 U.S. states and the District of Columbia.
US Value
(10.97)
The regional value is compared to the national value.
Prior Value
(0.00)
Prior Value compares a measured value with the previously measured value. Confidence intervals were not taken into account in determining the direction of the comparison.
Trend
This comparison measures the indicator’s values over multiple time periods.<br>The Mann-Kendall Test for Statistical Significance is used to evaluate the trend<br>over 4 to 10 periods of measure, subject to data availability and comparability.
State: Hawaii Flu Vaccinations: Medicare Population
State: Hawaii Flu Vaccinations: Medicare Population
52.0%
(2022)
Compared to:
U.S. States
The distribution is based on data from 50 U.S. states and the District of Columbia.
US Value
(50.0%)
The regional value is compared to the national value.
Prior Value
(51.0%)
Prior Value compares a measured value with the previously measured value. Confidence intervals were not taken into account in determining the direction of the comparison.
Trend
This comparison measures the indicator’s values over multiple time periods.<br>The Mann-Kendall Test for Statistical Significance is used to evaluate the trend<br>over 4 to 10 periods of measure, subject to data availability and comparability.
State: Hawaii Gonorrhea Among Females
State: Hawaii Gonorrhea Among Females
77.3
Cases per 100,000 females
(2019)
Compared to:
US Value
(101.3 in 2014)
The regional value is compared to the national value.
Prior Value
(74.6)
Prior Value compares a measured value with the previously measured value. Confidence intervals were not taken into account in determining the direction of the comparison.
Trend
This comparison measures the indicator’s values over multiple time periods.<br>The Mann-Kendall Test for Statistical Significance is used to evaluate the trend<br>over 4 to 10 periods of measure, subject to data availability and comparability.
State: Hawaii Gonorrhea Among Males
State: Hawaii Gonorrhea Among Males
133.6
Cases per 100,000 males
(2019)
Compared to:
US Value
(223.7)
The regional value is compared to the national value.
Prior Value
(133.9)
Prior Value compares a measured value with the previously measured value. Confidence intervals were not taken into account in determining the direction of the comparison.
Trend
This comparison measures the indicator’s values over multiple time periods.<br>The Mann-Kendall Test for Statistical Significance is used to evaluate the trend<br>over 4 to 10 periods of measure, subject to data availability and comparability.
State: Hawaii Hepatitis B Death Rate
State: Hawaii Hepatitis B Death Rate
0.3
Deaths per 100,000 population
(2018-2022)
Compared to:
US Value
(0.1 in 2021)
The regional value is compared to the national value.
Prior Value
(0.3)
Prior Value compares a measured value with the previously measured value. Confidence intervals were taken into account in determining the direction of the comparison.
Trend
This comparison measures the indicator’s values over multiple time periods.<br>The Mann-Kendall Test for Statistical Significance is used to evaluate the trend<br>over 4 to 10 periods of measure, subject to data availability and comparability.
State: Hawaii Hepatitis C Death Rate
State: Hawaii Hepatitis C Death Rate
0.5
Deaths per 100,000 population
(2020-2022)
Compared to:
US Value
(0.7 in 2021)
The regional value is compared to the national value.
Prior Value
(0.7)
Prior Value compares a measured value with the previously measured value. Confidence intervals were taken into account in determining the direction of the comparison.
Trend
This comparison measures the indicator’s values over multiple time periods.<br>The Mann-Kendall Test for Statistical Significance is used to evaluate the trend<br>over 4 to 10 periods of measure, subject to data availability and comparability.
State: Hawaii HIV Testing Among Adults
State: Hawaii HIV Testing Among Adults
30.5%
(2022)
Compared to:
Median Value for States and Territories
(36.3%)
The regional value is compared to the median value for states and territories.
Prior Value
(30.6%)
Prior Value compares a measured value with the previously measured value. Confidence intervals were taken into account in determining the direction of the comparison.
Trend
This comparison measures the indicator’s values over multiple time periods.<br>The Mann-Kendall Test for Statistical Significance is used to evaluate the trend<br>over 4 to 10 periods of measure, subject to data availability and comparability.
State: Hawaii HIV Testing Among Tuberculosis Patients
State: Hawaii HIV Testing Among Tuberculosis Patients
96.0%
(2015)
Compared to:
Prior Value
(99.0%)
Prior Value compares a measured value with the previously measured value. Confidence intervals were not taken into account in determining the direction of the comparison.
Trend
This comparison measures the indicator’s values over multiple time periods.<br>The Mann-Kendall Test for Statistical Significance is used to evaluate the trend<br>over 4 to 10 periods of measure, subject to data availability and comparability.
State: Hawaii Influenza Vaccination Rate 18-64 yrs
State: Hawaii Influenza Vaccination Rate 18-64 yrs
44.0%
(2022)
Compared to:
Prior Value
(40.6%)
Prior Value compares a measured value with the previously measured value. Confidence intervals were taken into account in determining the direction of the comparison.
Trend
This comparison measures the indicator’s values over multiple time periods.<br>The Mann-Kendall Test for Statistical Significance is used to evaluate the trend<br>over 4 to 10 periods of measure, subject to data availability and comparability.
HP 2030 Target
(70.0%)
<div>
<div>IID-09: Increase the proportion of people who get the flu vaccine every year <strong>(LEADING HEALTH INDICATOR)</strong></div>
<div> </div>
<div>The national objective includes all persons 6 months and older. The data source for the national indicator is the National Health Interview Survey, which does not provide state-level data for Hawaiʻi. The state data source for adults is the Behavioral Risk Factor Surveillance System, which is comparable to the national source. </div>
</div>
State: Hawaii Influenza Vaccination Rate 65+
State: Hawaii Influenza Vaccination Rate 65+
70.2%
(2022)
Compared to:
Median Value for States and Territories
(67.7%)
The regional value is compared to the median value for states and territories.
Prior Value
(65.6%)
Prior Value compares a measured value with the previously measured value. Confidence intervals were taken into account in determining the direction of the comparison.
Trend
This comparison measures the indicator’s values over multiple time periods.<br>The Mann-Kendall Test for Statistical Significance is used to evaluate the trend<br>over 4 to 10 periods of measure, subject to data availability and comparability.
HP 2030 Target
(70.0%)
<div>
<div>IID-09: Increase the proportion of people who get the flu vaccine every year <strong>(LEADING HEALTH INDICATOR)</strong></div>
<div> </div>
<div>The national objective includes all persons 6 months and older. The data source for the national indicator is the National Health Interview Survey, which does not provide state-level data for Hawaiʻi. The state data source for adults is the Behavioral Risk Factor Surveillance System, which is comparable to the national source. </div>
</div>
State: Hawaii Monitoring Influenza Resistance to Antivirals
State: Hawaii Monitoring Influenza Resistance to Antivirals
1
(2017)
Compared to:
Prior Value
(1)
Prior Value compares a measured value with the previously measured value. Confidence intervals were not taken into account in determining the direction of the comparison.
Trend
This comparison measures the indicator’s values over multiple time periods.<br>The Mann-Kendall Test for Statistical Significance is used to evaluate the trend<br>over 4 to 10 periods of measure, subject to data availability and comparability.
State: Hawaii Persons Who Got the Flu Vaccine
State: Hawaii Persons Who Got the Flu Vaccine
50.2%
(2021-2022)
Compared to:
Prior Value
(54.2%)
Prior Value compares a measured value with the previously measured value. Confidence intervals were taken into account in determining the direction of the comparison.
Trend
This comparison measures the indicator’s values over multiple time periods.<br>The Mann-Kendall Test for Statistical Significance is used to evaluate the trend<br>over 4 to 10 periods of measure, subject to data availability and comparability.
HP 2030 LHI
(70.0%)
<div>
<div>IID-09: Increase the proportion of people who get the flu vaccine every year <strong>(LEADING HEALTH INDICATOR)</strong></div>
<div> </div>
<div>The national objective includes all persons 6 months and older. The data source for the national indicator is the National Health Interview Survey, which does not provide state-level data for Hawaiʻi. The state data sources are the National Immunization Survey for children 6 months to 17 years and the Behavioral Risk Factor Surveillance System for adults 18 years and older, which are comparable to the national source. </div>
</div>
State: Hawaii Pneumonia Vaccination Rate 65+
State: Hawaii Pneumonia Vaccination Rate 65+
62.0%
(2022)
Compared to:
Median Value for States and Territories
(71.4%)
The regional value is compared to the median value for states and territories.
Prior Value
(60.4%)
Prior Value compares a measured value with the previously measured value. Confidence intervals were taken into account in determining the direction of the comparison.
Trend
This comparison measures the indicator’s values over multiple time periods.<br>The Mann-Kendall Test for Statistical Significance is used to evaluate the trend<br>over 4 to 10 periods of measure, subject to data availability and comparability.
State: Hawaii Pneumonia Vaccinations: Medicare Population
State: Hawaii Pneumonia Vaccinations: Medicare Population
8.0%
(2022)
Compared to:
U.S. States
The distribution is based on data from 50 U.S. states and the District of Columbia.
US Value
(8.0%)
The regional value is compared to the national value.
Prior Value
(5.0%)
Prior Value compares a measured value with the previously measured value. Confidence intervals were not taken into account in determining the direction of the comparison.
Trend
This comparison measures the indicator’s values over multiple time periods.<br>The Mann-Kendall Test for Statistical Significance is used to evaluate the trend<br>over 4 to 10 periods of measure, subject to data availability and comparability.
State: Hawaii Recent HIV Testing Among Young Adults
State: Hawaii Recent HIV Testing Among Young Adults
73.0%
(2022)
Compared to:
Prior Value
(77.7%)
Prior Value compares a measured value with the previously measured value. Confidence intervals were taken into account in determining the direction of the comparison.
Trend
This comparison measures the indicator’s values over multiple time periods.<br>The Mann-Kendall Test for Statistical Significance is used to evaluate the trend<br>over 4 to 10 periods of measure, subject to data availability and comparability.
86.8%
(2014)
Compared to:
Prior Value
(85.6%)
Prior Value compares a measured value with the previously measured value. Confidence intervals were not taken into account in determining the direction of the comparison.
State: Hawaii Syphilis Among Females
State: Hawaii Syphilis Among Females
3.4
Cases per 100,000 females
(2019)
Compared to:
US Value
(1.1 in 2014)
The regional value is compared to the national value.
Prior Value
(1.0)
Prior Value compares a measured value with the previously measured value. Confidence intervals were not taken into account in determining the direction of the comparison.
Trend
This comparison measures the indicator’s values over multiple time periods.<br>The Mann-Kendall Test for Statistical Significance is used to evaluate the trend<br>over 4 to 10 periods of measure, subject to data availability and comparability.
State: Hawaii Syphilis Among Males
State: Hawaii Syphilis Among Males
13.0
Cases per 100,000 males
(2019)
Compared to:
US Value
(11.7 in 2014)
The regional value is compared to the national value.
Prior Value
(12.1)
Prior Value compares a measured value with the previously measured value. Confidence intervals were not taken into account in determining the direction of the comparison.
Trend
This comparison measures the indicator’s values over multiple time periods.<br>The Mann-Kendall Test for Statistical Significance is used to evaluate the trend<br>over 4 to 10 periods of measure, subject to data availability and comparability.
State: Hawaii Treatment Completion Among Latent Tuberculosis Patients
State: Hawaii Treatment Completion Among Latent Tuberculosis Patients
50.0%
(2012)
Compared to:
US Value
(65.9%)
The regional value is compared to the national value.
Prior Value
(76.5%)
Prior Value compares a measured value with the previously measured value. Confidence intervals were not taken into account in determining the direction of the comparison.
Trend
This comparison measures the indicator’s values over multiple time periods.<br>The Mann-Kendall Test for Statistical Significance is used to evaluate the trend<br>over 4 to 10 periods of measure, subject to data availability and comparability.
State: Hawaii Treatment Completion Among Tuberculosis Patients
State: Hawaii Treatment Completion Among Tuberculosis Patients
92.3%
(2012)
Compared to:
US Value
(89.4%)
The regional value is compared to the national value.
Prior Value
(90.0%)
Prior Value compares a measured value with the previously measured value. Confidence intervals were not taken into account in determining the direction of the comparison.
Trend
This comparison measures the indicator’s values over multiple time periods.<br>The Mann-Kendall Test for Statistical Significance is used to evaluate the trend<br>over 4 to 10 periods of measure, subject to data availability and comparability.
State: Hawaii Tuberculosis Incidence Rate
State: Hawaii Tuberculosis Incidence Rate
6.9
Cases per 100,000 population
(2022)
Compared to:
US Value
(2.5)
The regional value is compared to the national value. The source for the national value is Centers for Disease Control and Prevention
Prior Value
(7.4)
Prior Value compares a measured value with the previously measured value. Confidence intervals were not taken into account in determining the direction of the comparison.
Trend
This comparison measures the indicator’s values over multiple time periods.<br>The Mann-Kendall Test for Statistical Significance is used to evaluate the trend<br>over 4 to 10 periods of measure, subject to data availability and comparability.
HP 2030 Target
(1.4)
State: Hawaii
Health / Maternal, Fetal & Infant Health
Value
Compared to:
State: Hawaii Attended a Childbirth Class During Last Pregnancy
State: Hawaii Attended a Childbirth Class During Last Pregnancy
20.5%
(2014)
Compared to:
US Value
(21.5%)
The regional value is compared to the national value.
Prior Value
(24.4%)
Prior Value compares a measured value with the previously measured value. Confidence intervals were taken into account in determining the direction of the comparison.
State: Hawaii Babies with Low Birth Weight
State: Hawaii Babies with Low Birth Weight
8.4%
(2022)
Compared to:
US Value
(8.5% in 2021)
The regional value is compared to the national value.
Prior Value
(8.8%)
Prior Value compares a measured value with the previously measured value. Confidence intervals were taken into account in determining the direction of the comparison.
Trend
This comparison measures the indicator’s values over multiple time periods.<br>The Mann-Kendall Test for Statistical Significance is used to evaluate the trend<br>over 4 to 10 periods of measure, subject to data availability and comparability.
