
Search for Indicators
Disparities Dashboard
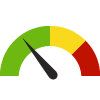
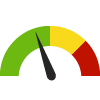
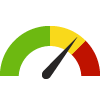
Indicator Gauge Icon Legend
Legend Colors
Red is bad, green is good, blue is not statistically different/neutral.
Compared to Distribution
 the value is in the best half of communities.
 the value is in the 2nd worst quarter of communities.
 the value is in the worst quarter of communities.
Compared to Target
 meets target;
  does not meet target.
Compared to a Single Value
 lower than the comparison value;
 higher than the comparison value;
 not statistically different from comparison value.
Trend

 non-significant change over time;
 significant change over time;
  no change over time.
Compared to Prior Value
 higher than the previous measurement period;
 lower than the previous measurement period;
 no statistically different change from previous measurement period.
 Significantly better than the overall value
 Significantly worse than the overall value
 Significantly different than the overall value
 No significant difference with the overall value
 No data on significance available
State: Hawaii
Health / Adolescent Health
Value
Compared to:
21.9%
(2020-2021)
Compared to:

US Value
(20.5%)
The regional value is compared to the national value.
Prior Value
(15.9%)
Prior Value compares a measured value with the previously measured value. Confidence intervals were taken into account in determining the direction of the comparison.
Trend
This comparison measures the indicator’s values over multiple time periods.<br>The Mann-Kendall Test for Statistical Significance is used to evaluate the trend<br>over 4 to 10 periods of measure, subject to data availability and comparability.
State: Hawaii Intimate Partner Violence Among Teens
State: Hawaii Intimate Partner Violence Among Teens
5.9%
(2021)
Compared to:
US Value
(8.5%)
The regional value is compared to the national value.
Prior Value
(8.6%)
Prior Value compares a measured value with the previously measured value. Confidence intervals were taken into account in determining the direction of the comparison.
Trend
This comparison measures the indicator’s values over multiple time periods.<br>The Mann-Kendall Test for Statistical Significance is used to evaluate the trend<br>over 4 to 10 periods of measure, subject to data availability and comparability.
State: Hawaii Intimate Partner Violence Among Young Teens
State: Hawaii Intimate Partner Violence Among Young Teens
5.1%
(2021)
Compared to:
Prior Value
(9.7%)
Prior Value compares a measured value with the previously measured value. Confidence intervals were taken into account in determining the direction of the comparison.
Trend
This comparison measures the indicator’s values over multiple time periods.<br>The Mann-Kendall Test for Statistical Significance is used to evaluate the trend<br>over 4 to 10 periods of measure, subject to data availability and comparability.
State: Hawaii LGB Teens Who Are Bullied
State: Hawaii LGB Teens Who Are Bullied
16.3%
(2021)
Compared to:
US Value
(24.9%)
The regional value is compared to the national value.
Prior Value
(25.8%)
Prior Value compares a measured value with the previously measured value. Confidence intervals were taken into account in determining the direction of the comparison.
Trend
This comparison measures the indicator’s values over multiple time periods.<br>The Mann-Kendall Test for Statistical Significance is used to evaluate the trend<br>over 4 to 10 periods of measure, subject to data availability and comparability.
HP 2030 Target
(25.1%)
<div><span>LGBT-05: Reduce bullying of lesbian, gay, or bisexual high school students<br /><br />The national indicator definition and data source are the same as for the state.</span></div>
State: Hawaii LGB Teens with Suicidal Thoughts
State: Hawaii LGB Teens with Suicidal Thoughts
39.1%
(2021)
Compared to:

US Value
(48.1%)
The regional value is compared to the national value.
Prior Value
(34.9%)
Prior Value compares a measured value with the previously measured value. Confidence intervals were taken into account in determining the direction of the comparison.
Trend
This comparison measures the indicator’s values over multiple time periods.<br>The Mann-Kendall Test for Statistical Significance is used to evaluate the trend<br>over 4 to 10 periods of measure, subject to data availability and comparability.
HP 2030 Target
(52.1%)
<div><span>LGBT-06: Reduce suicidal thoughts in lesbian, gay, or bisexual high school students<br /><br />The national indicator definition includes making a plan or attempting suicide in the past 12 months. The data source is the same as for the state.</span></div>
State: Hawaii Teens Exposed to Secondhand Smoke
State: Hawaii Teens Exposed to Secondhand Smoke
30.9%
(2019)
Compared to:
Prior Value
(23.8%)
Prior Value compares a measured value with the previously measured value. Confidence intervals were taken into account in determining the direction of the comparison.
Trend
This comparison measures the indicator’s values over multiple time periods.<br>The Mann-Kendall Test for Statistical Significance is used to evaluate the trend<br>over 4 to 10 periods of measure, subject to data availability and comparability.
State: Hawaii Teens Exposed to Secondhand Smoke in a Car
State: Hawaii Teens Exposed to Secondhand Smoke in a Car
24.2%
(2019)
Compared to:

Prior Value
(17.1%)
Prior Value compares a measured value with the previously measured value. Confidence intervals were taken into account in determining the direction of the comparison.
Trend
This comparison measures the indicator’s values over multiple time periods.<br>The Mann-Kendall Test for Statistical Significance is used to evaluate the trend<br>over 4 to 10 periods of measure, subject to data availability and comparability.
TPC Plan Target
(0%)
State: Hawaii Teens Exposed to Secondhand Smoke in the Home
State: Hawaii Teens Exposed to Secondhand Smoke in the Home
30.4%
(2019)
Compared to:
Prior Value
(26.0%)
Prior Value compares a measured value with the previously measured value. Confidence intervals were taken into account in determining the direction of the comparison.
Trend
This comparison measures the indicator’s values over multiple time periods.<br>The Mann-Kendall Test for Statistical Significance is used to evaluate the trend<br>over 4 to 10 periods of measure, subject to data availability and comparability.
TPC Plan Target
(0%)
State: Hawaii Teens Exposed to Tobacco Marketing
State: Hawaii Teens Exposed to Tobacco Marketing
94.4%
(2015)
Compared to:
Prior Value
(95.5%)
Prior Value compares a measured value with the previously measured value. Confidence intervals were taken into account in determining the direction of the comparison.
State: Hawaii Teens Who Are Bullied
State: Hawaii Teens Who Are Bullied
10.5%
(2021)
Compared to:
US Value
(15.0%)
The regional value is compared to the national value.
Prior Value
(17.0%)
Prior Value compares a measured value with the previously measured value. Confidence intervals were taken into account in determining the direction of the comparison.
Trend
This comparison measures the indicator’s values over multiple time periods.<br>The Mann-Kendall Test for Statistical Significance is used to evaluate the trend<br>over 4 to 10 periods of measure, subject to data availability and comparability.
State: Hawaii Teens Who Are Cyberbullied
State: Hawaii Teens Who Are Cyberbullied
11.8%
(2021)
Compared to:
US Value
(15.9%)
The regional value is compared to the national value.
Prior Value
(13.1%)
Prior Value compares a measured value with the previously measured value. Confidence intervals were taken into account in determining the direction of the comparison.
Trend
This comparison measures the indicator’s values over multiple time periods.<br>The Mann-Kendall Test for Statistical Significance is used to evaluate the trend<br>over 4 to 10 periods of measure, subject to data availability and comparability.
State: Hawaii Teens Who Ever Used illicit drugs
State: Hawaii Teens Who Ever Used illicit drugs
27.8%
(2021)
Compared to:

US Value
(13.1%)
The regional value is compared to the national value.
Prior Value
(39.0%)
Prior Value compares a measured value with the previously measured value. Confidence intervals were taken into account in determining the direction of the comparison.
State: Hawaii Teens Who Get Mental Health Help They Need
State: Hawaii Teens Who Get Mental Health Help They Need
20.1%
(2021)
Compared to:
Prior Value
(20.9%)
Prior Value compares a measured value with the previously measured value. Confidence intervals were taken into account in determining the direction of the comparison.
State: Hawaii Teens Who Get Sufficient Sleep
State: Hawaii Teens Who Get Sufficient Sleep
23.5%
(2021)
Compared to:
US Value
(22.7%)
The regional value is compared to the national value.
Prior Value
(22.8%)
Prior Value compares a measured value with the previously measured value. Confidence intervals were taken into account in determining the direction of the comparison.
Trend
This comparison measures the indicator’s values over multiple time periods.<br>The Mann-Kendall Test for Statistical Significance is used to evaluate the trend<br>over 4 to 10 periods of measure, subject to data availability and comparability.
HP 2030 Target
(27.4%)
<div>
<div><span class="bold"><span>SH-04: </span></span><span>Increase the proportion of high school students in grades who get enough sleep</span></div>
<div> </div>
<div><span>The national indicator definition and data source are the same as for the state.</span></div>
</div>
54.5%
(2019)
Compared to:
Prior Value
(57.2%)
Prior Value compares a measured value with the previously measured value. Confidence intervals were taken into account in determining the direction of the comparison.
Trend
This comparison measures the indicator’s values over multiple time periods.<br>The Mann-Kendall Test for Statistical Significance is used to evaluate the trend<br>over 4 to 10 periods of measure, subject to data availability and comparability.
59.8%
(2019)
Compared to:
US Value
(77.1% in 2013)
The regional value is compared to the national value.
Prior Value
(65.4%)
Prior Value compares a measured value with the previously measured value. Confidence intervals were taken into account in determining the direction of the comparison.
Trend
This comparison measures the indicator’s values over multiple time periods.<br>The Mann-Kendall Test for Statistical Significance is used to evaluate the trend<br>over 4 to 10 periods of measure, subject to data availability and comparability.
45.5%
(2015)
Compared to:
US Value
(19.3% in 2013)
The regional value is compared to the national value.
Prior Value
(47.4%)
Prior Value compares a measured value with the previously measured value. Confidence intervals were taken into account in determining the direction of the comparison.
State: Hawaii Teens Who Often See Tobacco Ads on the Internet
State: Hawaii Teens Who Often See Tobacco Ads on the Internet
51.4%
(2019)
Compared to:
US Value
(33.1% in 2013)
The regional value is compared to the national value.
Prior Value
(44.5%)
Prior Value compares a measured value with the previously measured value. Confidence intervals were taken into account in determining the direction of the comparison.
Trend
This comparison measures the indicator’s values over multiple time periods.<br>The Mann-Kendall Test for Statistical Significance is used to evaluate the trend<br>over 4 to 10 periods of measure, subject to data availability and comparability.
State: Hawaii Teens Who Participated in an Anti-Tobacco Event
State: Hawaii Teens Who Participated in an Anti-Tobacco Event
19.2%
(2015)
Compared to:
Prior Value
(24.2%)
Prior Value compares a measured value with the previously measured value. Confidence intervals were taken into account in determining the direction of the comparison.
Trend
This comparison measures the indicator’s values over multiple time periods.<br>The Mann-Kendall Test for Statistical Significance is used to evaluate the trend<br>over 4 to 10 periods of measure, subject to data availability and comparability.
State: Hawaii Teens Who Saw or Heard Anti-Smoking Ads
State: Hawaii Teens Who Saw or Heard Anti-Smoking Ads
61.8%
(2015)
Compared to:

Prior Value
(66.3%)
Prior Value compares a measured value with the previously measured value. Confidence intervals were taken into account in determining the direction of the comparison.
Trend
This comparison measures the indicator’s values over multiple time periods.<br>The Mann-Kendall Test for Statistical Significance is used to evaluate the trend<br>over 4 to 10 periods of measure, subject to data availability and comparability.
State: Hawaii Teens Who Skipped School for Safety
State: Hawaii Teens Who Skipped School for Safety
9.6%
(2021)
Compared to:

US Value
(8.6%)
The regional value is compared to the national value.
Prior Value
(12.4%)
Prior Value compares a measured value with the previously measured value. Confidence intervals were taken into account in determining the direction of the comparison.
Trend
This comparison measures the indicator’s values over multiple time periods.<br>The Mann-Kendall Test for Statistical Significance is used to evaluate the trend<br>over 4 to 10 periods of measure, subject to data availability and comparability.
58.2%
(2019)
Compared to:
US Value
(53.9%)
The regional value is compared to the national value.
Prior Value
(59.3%)
Prior Value compares a measured value with the previously measured value. Confidence intervals were taken into account in determining the direction of the comparison.
Trend
This comparison measures the indicator’s values over multiple time periods.<br>The Mann-Kendall Test for Statistical Significance is used to evaluate the trend<br>over 4 to 10 periods of measure, subject to data availability and comparability.
PAN Plan Target
(82.6%)
State: Hawaii Teens with 2 Hours or Less of TV Time
State: Hawaii Teens with 2 Hours or Less of TV Time
82.9%
(2019)
Compared to:
US Value
(80.2%)
The regional value is compared to the national value.
Prior Value
(81.6%)
Prior Value compares a measured value with the previously measured value. Confidence intervals were taken into account in determining the direction of the comparison.
Trend
This comparison measures the indicator’s values over multiple time periods.<br>The Mann-Kendall Test for Statistical Significance is used to evaluate the trend<br>over 4 to 10 periods of measure, subject to data availability and comparability.
PAN Plan Target
(73.9%)
State: Hawaii Teens with Recent Depression
State: Hawaii Teens with Recent Depression
34.8%
(2021)
Compared to:
US Value
(42.3%)
The regional value is compared to the national value.
Prior Value
(34.7%)
Prior Value compares a measured value with the previously measured value. Confidence intervals were taken into account in determining the direction of the comparison.
Trend
This comparison measures the indicator’s values over multiple time periods.<br>The Mann-Kendall Test for Statistical Significance is used to evaluate the trend<br>over 4 to 10 periods of measure, subject to data availability and comparability.
State: Hawaii Teens with Suicidal Thoughts
State: Hawaii Teens with Suicidal Thoughts
16.6%
(2021)
Compared to:
US Value
(22.2%)
The regional value is compared to the national value.
Prior Value
(16.7%)
Prior Value compares a measured value with the previously measured value. Confidence intervals were taken into account in determining the direction of the comparison.
Trend
This comparison measures the indicator’s values over multiple time periods.<br>The Mann-Kendall Test for Statistical Significance is used to evaluate the trend<br>over 4 to 10 periods of measure, subject to data availability and comparability.
State: Hawaii Young Teen Nonsmokers Exposed to Secondhand Smoke
State: Hawaii Young Teen Nonsmokers Exposed to Secondhand Smoke
27.9%
(2019)
Compared to:
Prior Value
(25.6%)
Prior Value compares a measured value with the previously measured value. Confidence intervals were taken into account in determining the direction of the comparison.
Trend
This comparison measures the indicator’s values over multiple time periods.<br>The Mann-Kendall Test for Statistical Significance is used to evaluate the trend<br>over 4 to 10 periods of measure, subject to data availability and comparability.
TPC Plan Target
(0%)
State: Hawaii Young Teens Exposed to Secondhand Smoke in a Car
State: Hawaii Young Teens Exposed to Secondhand Smoke in a Car
15.9%
(2019)
Compared to:
Prior Value
(14.5%)
Prior Value compares a measured value with the previously measured value. Confidence intervals were taken into account in determining the direction of the comparison.
Trend
This comparison measures the indicator’s values over multiple time periods.<br>The Mann-Kendall Test for Statistical Significance is used to evaluate the trend<br>over 4 to 10 periods of measure, subject to data availability and comparability.
TPC Plan Target
(0%)
State: Hawaii Young Teens Exposed to Secondhand Smoke in the Home
State: Hawaii Young Teens Exposed to Secondhand Smoke in the Home
27.4%
(2019)
Compared to:
Prior Value
(26.3%)
Prior Value compares a measured value with the previously measured value. Confidence intervals were taken into account in determining the direction of the comparison.
Trend
This comparison measures the indicator’s values over multiple time periods.<br>The Mann-Kendall Test for Statistical Significance is used to evaluate the trend<br>over 4 to 10 periods of measure, subject to data availability and comparability.
TPC Plan Target
(0%)
State: Hawaii Young Teens Exposed to Tobacco Marketing
State: Hawaii Young Teens Exposed to Tobacco Marketing
93.6%
(2015)
Compared to:
Prior Value
(93.2%)
Prior Value compares a measured value with the previously measured value. Confidence intervals were taken into account in determining the direction of the comparison.
State: Hawaii Young Teens Who Are Bullied
State: Hawaii Young Teens Who Are Bullied
33.5%
(2021)
Compared to:
Prior Value
(37.8%)
Prior Value compares a measured value with the previously measured value. Confidence intervals were taken into account in determining the direction of the comparison.
Trend
This comparison measures the indicator’s values over multiple time periods.<br>The Mann-Kendall Test for Statistical Significance is used to evaluate the trend<br>over 4 to 10 periods of measure, subject to data availability and comparability.
State: Hawaii Young Teens Who Are Cyberbullied
State: Hawaii Young Teens Who Are Cyberbullied
27.7%
(2021)
Compared to:
Prior Value
(22.7%)
Prior Value compares a measured value with the previously measured value. Confidence intervals were taken into account in determining the direction of the comparison.
Trend
This comparison measures the indicator’s values over multiple time periods.<br>The Mann-Kendall Test for Statistical Significance is used to evaluate the trend<br>over 4 to 10 periods of measure, subject to data availability and comparability.
State: Hawaii Young Teens Who Get Mental Health Help They Need
State: Hawaii Young Teens Who Get Mental Health Help They Need
22.8%
(2021)
Compared to:
Prior Value
(25.9%)
Prior Value compares a measured value with the previously measured value. Confidence intervals were taken into account in determining the direction of the comparison.
State: Hawaii Young Teens Who Get Sufficient Sleep
State: Hawaii Young Teens Who Get Sufficient Sleep
46.1%
(2021)
Compared to:
Prior Value
(46.5%)
Prior Value compares a measured value with the previously measured value. Confidence intervals were taken into account in determining the direction of the comparison.
Trend
This comparison measures the indicator’s values over multiple time periods.<br>The Mann-Kendall Test for Statistical Significance is used to evaluate the trend<br>over 4 to 10 periods of measure, subject to data availability and comparability.
HP 2030 Target
(27.4%)
<div>
<div><span class="bold"><span>SH-04: </span></span><span>Increase the proportion of students in grades 9 through 12 who get sufficient sleep</span></div>
<div> </div>
<div><span>The national indicator definition and data source are the same as for the state. There is no national middle school survey for students in grades 6-8; however, Hawaiʻi has additional data for this indicator. </span></div>
</div>
52.3%
(2019)
Compared to:
Prior Value
(55.8%)
Prior Value compares a measured value with the previously measured value. Confidence intervals were taken into account in determining the direction of the comparison.
Trend
This comparison measures the indicator’s values over multiple time periods.<br>The Mann-Kendall Test for Statistical Significance is used to evaluate the trend<br>over 4 to 10 periods of measure, subject to data availability and comparability.
52.2%
(2019)
Compared to:
US Value
(77.1% in 2013)
The regional value is compared to the national value.
Prior Value
(58.8%)
Prior Value compares a measured value with the previously measured value. Confidence intervals were taken into account in determining the direction of the comparison.
Trend
This comparison measures the indicator’s values over multiple time periods.<br>The Mann-Kendall Test for Statistical Significance is used to evaluate the trend<br>over 4 to 10 periods of measure, subject to data availability and comparability.
41.9%
(2015)
Compared to:
US Value
(19.3% in 2013)
The regional value is compared to the national value.
Prior Value
(42.5%)
Prior Value compares a measured value with the previously measured value. Confidence intervals were taken into account in determining the direction of the comparison.
State: Hawaii Young Teens Who Often See Tobacco Ads on the Internet
State: Hawaii Young Teens Who Often See Tobacco Ads on the Internet
44.9%
(2019)
Compared to:
US Value
(33.1% in 2013)
The regional value is compared to the national value.
Prior Value
(42.5%)
Prior Value compares a measured value with the previously measured value. Confidence intervals were taken into account in determining the direction of the comparison.
Trend
This comparison measures the indicator’s values over multiple time periods.<br>The Mann-Kendall Test for Statistical Significance is used to evaluate the trend<br>over 4 to 10 periods of measure, subject to data availability and comparability.
State: Hawaii Young Teens Who Participated in an Anti-Tobacco Event
State: Hawaii Young Teens Who Participated in an Anti-Tobacco Event
23.0%
(2015)
Compared to:
Prior Value
(30.4%)
Prior Value compares a measured value with the previously measured value. Confidence intervals were taken into account in determining the direction of the comparison.
Trend
This comparison measures the indicator’s values over multiple time periods.<br>The Mann-Kendall Test for Statistical Significance is used to evaluate the trend<br>over 4 to 10 periods of measure, subject to data availability and comparability.
State: Hawaii Young Teens Who Saw or Heard Anti-Smoking Ads
State: Hawaii Young Teens Who Saw or Heard Anti-Smoking Ads
62.3%
(2015)
Compared to:
Prior Value
(58.6%)
Prior Value compares a measured value with the previously measured value. Confidence intervals were taken into account in determining the direction of the comparison.
Trend
This comparison measures the indicator’s values over multiple time periods.<br>The Mann-Kendall Test for Statistical Significance is used to evaluate the trend<br>over 4 to 10 periods of measure, subject to data availability and comparability.
State: Hawaii Young Teens Who Skipped School for Safety
State: Hawaii Young Teens Who Skipped School for Safety
7.9%
(2021)
Compared to:
Prior Value
(10.3%)
Prior Value compares a measured value with the previously measured value. Confidence intervals were taken into account in determining the direction of the comparison.
Trend
This comparison measures the indicator’s values over multiple time periods.<br>The Mann-Kendall Test for Statistical Significance is used to evaluate the trend<br>over 4 to 10 periods of measure, subject to data availability and comparability.
51.3%
(2019)
Compared to:
Prior Value
(55.4%)
Prior Value compares a measured value with the previously measured value. Confidence intervals were taken into account in determining the direction of the comparison.
Trend
This comparison measures the indicator’s values over multiple time periods.<br>The Mann-Kendall Test for Statistical Significance is used to evaluate the trend<br>over 4 to 10 periods of measure, subject to data availability and comparability.
PAN Plan Target
(100%)
State: Hawaii Young Teens with 2 Hours or Less of TV Time
State: Hawaii Young Teens with 2 Hours or Less of TV Time
76.2%
(2019)
Compared to:
Prior Value
(76.4%)
Prior Value compares a measured value with the previously measured value. Confidence intervals were taken into account in determining the direction of the comparison.
Trend
This comparison measures the indicator’s values over multiple time periods.<br>The Mann-Kendall Test for Statistical Significance is used to evaluate the trend<br>over 4 to 10 periods of measure, subject to data availability and comparability.
PAN Plan Target
(86.8%)
State: Hawaii Young Teens with Ever Depression
State: Hawaii Young Teens with Ever Depression
34.4%
(2021)
Compared to:
Prior Value
(30.5%)
Prior Value compares a measured value with the previously measured value. Confidence intervals were taken into account in determining the direction of the comparison.
Trend
This comparison measures the indicator’s values over multiple time periods.<br>The Mann-Kendall Test for Statistical Significance is used to evaluate the trend<br>over 4 to 10 periods of measure, subject to data availability and comparability.
State: Hawaii Young Teens with Suicidal Thoughts
State: Hawaii Young Teens with Suicidal Thoughts
26.9%
(2021)
Compared to:
Prior Value
(27.2%)
Prior Value compares a measured value with the previously measured value. Confidence intervals were taken into account in determining the direction of the comparison.
Trend
This comparison measures the indicator’s values over multiple time periods.<br>The Mann-Kendall Test for Statistical Significance is used to evaluate the trend<br>over 4 to 10 periods of measure, subject to data availability and comparability.
State: Hawaii
Health / Alcohol & Drug Use
Value
Compared to:
State: Hawaii Adults Who Binge Drink
State: Hawaii Adults Who Binge Drink
18.2%
(2022)
Compared to:
Median Value for States and Territories
(16.9%)
The regional value is compared to the median value for states and territories.
Prior Value
(16.6%)
Prior Value compares a measured value with the previously measured value. Confidence intervals were taken into account in determining the direction of the comparison.
Trend
This comparison measures the indicator’s values over multiple time periods.<br>The Mann-Kendall Test for Statistical Significance is used to evaluate the trend<br>over 4 to 10 periods of measure, subject to data availability and comparability.
HP 2030 LHI
(25.4%)
<div>SU-10: Reduce the proportion of people aged 21 years and over who engaged in binge drinking in the past month <strong>(LEADING HEALTH INDICATOR)</strong><br /> <br />The national indicator includes persons aged 21 and over. The data source for the national indicator is the National Survey on Drug Use and Health. The state data source is the Behavioral Risk Factor Surveillance System, which is comparable to the national source but includes adults 18 years and older.</div>
State: Hawaii Adults Who Drink Alcohol
State: Hawaii Adults Who Drink Alcohol
50.1%
(2022)
Compared to:
Median Value for States and Territories
(53.4%)
The regional value is compared to the median value for states and territories.
Prior Value
(49.1%)
Prior Value compares a measured value with the previously measured value. Confidence intervals were taken into account in determining the direction of the comparison.
Trend
This comparison measures the indicator’s values over multiple time periods.<br>The Mann-Kendall Test for Statistical Significance is used to evaluate the trend<br>over 4 to 10 periods of measure, subject to data availability and comparability.
State: Hawaii Adults Who Drink and Drive
State: Hawaii Adults Who Drink and Drive
2.9%
(2020)
Compared to:
Median Value for States and Territories
(2.3%)
The regional value is compared to the median value for states and territories.
Prior Value
(4.1%)
Prior Value compares a measured value with the previously measured value. Confidence intervals were taken into account in determining the direction of the comparison.
Trend
This comparison measures the indicator’s values over multiple time periods.<br>The Mann-Kendall Test for Statistical Significance is used to evaluate the trend<br>over 4 to 10 periods of measure, subject to data availability and comparability.
State: Hawaii Adults Who Drink Excessively
State: Hawaii Adults Who Drink Excessively
19.9%
(2022)
Compared to:
Prior Value
(18.2%)
Prior Value compares a measured value with the previously measured value. Confidence intervals were taken into account in determining the direction of the comparison.
Trend
This comparison measures the indicator’s values over multiple time periods.<br>The Mann-Kendall Test for Statistical Significance is used to evaluate the trend<br>over 4 to 10 periods of measure, subject to data availability and comparability.
State: Hawaii Adults Who Drink Heavily
State: Hawaii Adults Who Drink Heavily
8.1%
(2022)
Compared to:
Median Value for States and Territories
(6.8%)
The regional value is compared to the median value for states and territories.
Prior Value
(7.0%)
Prior Value compares a measured value with the previously measured value. Confidence intervals were taken into account in determining the direction of the comparison.
Trend
This comparison measures the indicator’s values over multiple time periods.<br>The Mann-Kendall Test for Statistical Significance is used to evaluate the trend<br>over 4 to 10 periods of measure, subject to data availability and comparability.
State: Hawaii Adults Who Use Marijuana
State: Hawaii Adults Who Use Marijuana
11.8%
(2022)
Compared to:
Prior Value
(10.8%)
Prior Value compares a measured value with the previously measured value. Confidence intervals were taken into account in determining the direction of the comparison.
State: Hawaii Average Annual Deaths Attributable to Alcohol
State: Hawaii Average Annual Deaths Attributable to Alcohol
526
Avg ann deaths
(2015-2019)
Compared to:
Prior Value
(349)
Prior Value compares a measured value with the previously measured value. Confidence intervals were not taken into account in determining the direction of the comparison.
Trend
This comparison measures the indicator’s values over multiple time periods.<br>The Mann-Kendall Test for Statistical Significance is used to evaluate the trend<br>over 4 to 10 periods of measure, subject to data availability and comparability.
State: Hawaii Cirrhosis Death Rate
State: Hawaii Cirrhosis Death Rate
7.4
Deaths per 100,000 population
(2022)
Compared to:
US Value
(14.5 in 2021)
The regional value is compared to the national value.
Prior Value
(9.2)
Prior Value compares a measured value with the previously measured value. Confidence intervals were taken into account in determining the direction of the comparison.
Trend
This comparison measures the indicator’s values over multiple time periods.<br>The Mann-Kendall Test for Statistical Significance is used to evaluate the trend<br>over 4 to 10 periods of measure, subject to data availability and comparability.
HP 2030 Target
(10.9)
<div>
<div>SU-02: Reduce cirrhosis deaths</div>
<div> </div>
<div>The national indicator definition and data source are the same as for the state.</div>
</div>
State: Hawaii Drug and Opioid-Involved Overdose Death Rate
State: Hawaii Drug and Opioid-Involved Overdose Death Rate
16.1
Deaths per 100,000 population
(2018-2020)
Compared to:
U.S. States
The distribution is based on data from 50 U.S. states and the District of Columbia.
US Value
(23.5)
The regional value is compared to the national value.
Prior Value
(15.8)
Prior Value compares a measured value with the previously measured value. Confidence intervals were taken into account in determining the direction of the comparison.
HP 2030 Target
(13.1)
<div>IVP-20: Reduce overdose deaths involving opioids</div>
<div> </div>
<div>The national indicator definition and data source are the same as for the state.</div>
State: Hawaii Drug Overdose Death Rate
State: Hawaii Drug Overdose Death Rate
16.7
Deaths per 100,000 population
(2022)
Compared to:
US Value
(32.4 in 2021)
The regional value is compared to the national value.
Prior Value
(16.3)
Prior Value compares a measured value with the previously measured value. Confidence intervals were taken into account in determining the direction of the comparison.
Trend
This comparison measures the indicator’s values over multiple time periods.<br>The Mann-Kendall Test for Statistical Significance is used to evaluate the trend<br>over 4 to 10 periods of measure, subject to data availability and comparability.
HP 2030 LHI
(20.7)
<div>
<div>SU-03: Reduce drug overdose deaths <strong>(LEADING HEALTH INDICATOR)</strong></div>
<div><strong></strong></div>
<div>The national indicator definition and data source are the same as for the state.</div>
</div>
State: Hawaii Illegal Drugs on School Property HS
State: Hawaii Illegal Drugs on School Property HS
25.4%
(2015)
Compared to:
US Value
(21.7%)
This distribution is based on the national average from YRBS, which is a national school-based survey of public schools.
Prior Value
(31.2%)
Prior Value compares a measured value with the previously measured value. Confidence intervals were taken into account in determining the direction of the comparison.
Trend
This comparison measures the indicator’s values over multiple time periods.<br>The Mann-Kendall Test for Statistical Significance is used to evaluate the trend<br>over 4 to 10 periods of measure, subject to data availability and comparability.
State: Hawaii Illegal Drugs on School Property MS
State: Hawaii Illegal Drugs on School Property MS
9.1%
(2015)
Compared to:
Prior Value
(8.2%)
Prior Value compares a measured value with the previously measured value. Confidence intervals were taken into account in determining the direction of the comparison.
Trend
This comparison measures the indicator’s values over multiple time periods.<br>The Mann-Kendall Test for Statistical Significance is used to evaluate the trend<br>over 4 to 10 periods of measure, subject to data availability and comparability.
State: Hawaii LGB Teens Who Use Illicit Drugs
State: Hawaii LGB Teens Who Use Illicit Drugs
38.6%
(2021)
Compared to:
US Value
(27.8% in 2019)
The regional value is compared to the national value.
Prior Value
(48.1%)
Prior Value compares a measured value with the previously measured value. Confidence intervals were taken into account in determining the direction of the comparison.
HP 2030 Target
(16.1%)
<div><span>LGBT-07: Reduce the proportion of lesbian, gay, or bisexual high school students who have used illicit drugs<br /><br />The national indicator definition and data source are the same as for the state.</span></div>
State: Hawaii Teen Boys Who Binge Drink
State: Hawaii Teen Boys Who Binge Drink
12.3%
(2017)
Compared to:
US Value
(18.6% in 2015)
This distribution is based on the national average from YRBS, which is a national school-based survey of public schools.
Prior Value
(8.8%)
Prior Value compares a measured value with the previously measured value. Confidence intervals were taken into account in determining the direction of the comparison.
HP 2030 Target
(8.4%)
<div><span>SU-09: Reduce the proportion of people under 21 years who engaged in binge drinking in the past month<br /> <br />The national indicator includes adolescents aged 12-20. The national data source is the National Survey on Drug Use and Health. The state data source is the Youth Risk Behavior Survey, which is comparable to the national data source. In order to account for the difference in the definition of 'binge drinking' for girls (4 drinks) versus boys (5 drinks), two separate reports are provided. This one is for boys, while 'Teen Girls Who Binge Drink' presents the data for girls.</span></div>
State: Hawaii Teen Girls Who Binge Drink
State: Hawaii Teen Girls Who Binge Drink
12.4%
(2017)
Compared to:
US Value
(16.8% in 2015)
This distribution is based on the national average from YRBS, which is a national school-based survey of public schools.
Prior Value
(11.2%)
Prior Value compares a measured value with the previously measured value. Confidence intervals were taken into account in determining the direction of the comparison.
HP 2030 Target
(8.4%)
<div><span>SU-09: Reduce the proportion of people under 21 years who engaged in binge drinking in the past month<br /> <br />The national indicator includes adolescents aged 12-20. The national data source is the National Survey on Drug Use and Health. The state data source is the Youth Risk Behavior Survey, which is comparable to the national data source. In order to account for the difference in the definition of 'binge drinking' for girls (4 drinks) versus boys (5 drinks), two separate reports are provided. This one is for girls, while 'Teen Boys Who Binge Drink' presents the data for boys.</span></div>
State: Hawaii Teens Who Binge Drink
State: Hawaii Teens Who Binge Drink
8.3%
(2021)
Compared to:
US Value
(10.5%)
The regional value is compared to the national value.
Prior Value
(10.9%)
Prior Value compares a measured value with the previously measured value. Confidence intervals were taken into account in determining the direction of the comparison.
Trend
This comparison measures the indicator’s values over multiple time periods.<br>The Mann-Kendall Test for Statistical Significance is used to evaluate the trend<br>over 4 to 10 periods of measure, subject to data availability and comparability.
HP 2030 Target
(8.4%)
<div><span>SU-09: Reduce the proportion of people under 21 years who engaged in binge drinking in the past month<br /> <br />The national indicator includes adolescents aged 12-20. The national data source is the National Survey on Drug Use and Health. The state data source is the Youth Risk Behavior Survey, which is comparable to the national data source. Binge drinking is defined the same in the YRBS and NSDUH for high school students in grades 9-12. </span></div>
State: Hawaii Teens Who Have Used Methamphetamines
State: Hawaii Teens Who Have Used Methamphetamines
1.8%
(2021)
Compared to:
US Value
(1.8%)
The regional value is compared to the national value.
Prior Value
(4.5%)
Prior Value compares a measured value with the previously measured value. Confidence intervals were taken into account in determining the direction of the comparison.
Trend
This comparison measures the indicator’s values over multiple time periods.<br>The Mann-Kendall Test for Statistical Significance is used to evaluate the trend<br>over 4 to 10 periods of measure, subject to data availability and comparability.
State: Hawaii Teens Who Use Alcohol
State: Hawaii Teens Who Use Alcohol
16.6%
(2021)
Compared to:
US Value
(22.7%)
The regional value is compared to the national value.
Prior Value
(20.4%)
Prior Value compares a measured value with the previously measured value. Confidence intervals were taken into account in determining the direction of the comparison.
Trend
This comparison measures the indicator’s values over multiple time periods.<br>The Mann-Kendall Test for Statistical Significance is used to evaluate the trend<br>over 4 to 10 periods of measure, subject to data availability and comparability.
HP 2030 Target
(6.3%)
<div><span>SU-04: Reduce the proportion of adolescents who drank alcohol in the past month<br /><br />The national indicator includes adolescents aged 12-17. The data source for the national indicator is the National Survey on Drug Use and Health. The state data source is the Youth Risk Behavior Survey, which is comparable to the national data source. It is divided into two groups: grades 6-8 and grades 9-12. This indicator reports data for students in grades 9-12, while the indicator ‘Young Teens Who Use Alcohol' reports for those in grades 6-8. </span></div>
State: Hawaii Teens Who Use Marijuana
State: Hawaii Teens Who Use Marijuana
12.0%
(2021)
Compared to:
US Value
(15.8%)
The regional value is compared to the national value.
Prior Value
(17.2%)
Prior Value compares a measured value with the previously measured value. Confidence intervals were taken into account in determining the direction of the comparison.
Trend
This comparison measures the indicator’s values over multiple time periods.<br>The Mann-Kendall Test for Statistical Significance is used to evaluate the trend<br>over 4 to 10 periods of measure, subject to data availability and comparability.
HP 2030 Target
(5.8%)
<div><span>SU-06: Reduce the proportion of adolescents who used marijuana in the past month<br /> <br />The national indicator includes adolescents aged 12-17. The national data source is the National Survey on Drug Use and Health. The state data source is the Youth Risk Behavior Survey, which is comparable to the national data source and provides more information for the state. It is divided into two groups: grades 6-8 and grades 9-12. This indicator reports data for students in grades 9-12, while the indicator ‘Young Teens Who Use Marijuana' reports for those in grades 6-8. </span></div>
State: Hawaii Young Teens Who Binge Drink
State: Hawaii Young Teens Who Binge Drink
2.1%
(2021)
Compared to:
Prior Value
(4.6%)
Prior Value compares a measured value with the previously measured value. Confidence intervals were taken into account in determining the direction of the comparison.
Trend
This comparison measures the indicator’s values over multiple time periods.<br>The Mann-Kendall Test for Statistical Significance is used to evaluate the trend<br>over 4 to 10 periods of measure, subject to data availability and comparability.
HP 2030 Target
(8.4%)
<div>SU-09: Reduce the proportion of people under 21 years who engaged in binge drinking in the past month</div>
<div> </div>
<div>The national indicator includes adolescents ages 12-20. The national data source is the National Survey on Drug Use and Health (NSDUH). The state data source is the Youth Risk Behavior Survey, which is comparable to the national data source. However, binge drinking is defined as 4 or more drinks on one occasional for girls and 5 or more drinks for boys in the NSDUH, but only as 5 or more drinks for boys or girls in this indicator for middle school students grades 6-8. </div>
State: Hawaii Young Teens Who Have Used Methamphetamines
State: Hawaii Young Teens Who Have Used Methamphetamines
1.7%
(2021)
Compared to:
Prior Value
(3.7%)
Prior Value compares a measured value with the previously measured value. Confidence intervals were taken into account in determining the direction of the comparison.
Trend
This comparison measures the indicator’s values over multiple time periods.<br>The Mann-Kendall Test for Statistical Significance is used to evaluate the trend<br>over 4 to 10 periods of measure, subject to data availability and comparability.
State: Hawaii Young Teens Who Use Alcohol
State: Hawaii Young Teens Who Use Alcohol
6.4%
(2021)
Compared to:
Prior Value
(7.0%)
Prior Value compares a measured value with the previously measured value. Confidence intervals were taken into account in determining the direction of the comparison.
Trend
This comparison measures the indicator’s values over multiple time periods.<br>The Mann-Kendall Test for Statistical Significance is used to evaluate the trend<br>over 4 to 10 periods of measure, subject to data availability and comparability.
HP 2030 Target
(6.3%)
<div><span>SU-04: Reduce the proportion of adolescents who drank alcohol in the past month<br /><br />The national indicator includes adolescents aged 12-17. The data source for the national indicator is the National Survey on Drug Use and Health. The state data source is the Youth Risk Behavior Survey, which is comparable to the national data source. It is divided into two groups: grades 6-8 and grades 9-12. This indicator reports data for students in grades 6-8, while the indicator ‘Teens Who Use Alcohol' reports for those in grades 9-12. </span></div>
State: Hawaii Young Teens Who Use Marijuana
State: Hawaii Young Teens Who Use Marijuana
2.8%
(2021)
Compared to:
Prior Value
(7.2%)
Prior Value compares a measured value with the previously measured value. Confidence intervals were taken into account in determining the direction of the comparison.
Trend
This comparison measures the indicator’s values over multiple time periods.<br>The Mann-Kendall Test for Statistical Significance is used to evaluate the trend<br>over 4 to 10 periods of measure, subject to data availability and comparability.
HP 2030 Target
(5.8%)
<div><span>SU-06: Reduce the proportion of adolescents who used marijuana in the past month<br /> <br />The national indicator includes adolescents aged 12-17. The national data source is the National Survey on Drug Use and Health. The state data source is the Youth Risk Behavior Survey, which is comparable to the national data source and provides more information for the state. It is divided into two groups: grades 6-8 and grades 9-12. This indicator reports data for students in grades 6-8, while the indicator ‘Teens Who Use Marijuana' reports for those in grades 9-12. </span></div>
State: Hawaii
Health / Cancer
Value
Compared to:
State: Hawaii Adults Who Have Had Cancer
State: Hawaii Adults Who Have Had Cancer
6.1%
(2021)
Compared to:
Median Value for States and Territories
(7.5%)
The regional value is compared to the median value for states and territories.
Prior Value
(5.8%)
Prior Value compares a measured value with the previously measured value. Confidence intervals were taken into account in determining the direction of the comparison.
Trend
This comparison measures the indicator’s values over multiple time periods.<br>The Mann-Kendall Test for Statistical Significance is used to evaluate the trend<br>over 4 to 10 periods of measure, subject to data availability and comparability.
Cancer Plan Target
(5.2%)
State: Hawaii Adults Who've Had Skin Cancer
State: Hawaii Adults Who've Had Skin Cancer
4.8%
(2021)
Compared to:
Median Value for States and Territories
(6.6%)
The regional value is compared to the median value for states and territories.
Prior Value
(4.5%)
Prior Value compares a measured value with the previously measured value. Confidence intervals were taken into account in determining the direction of the comparison.
Trend
This comparison measures the indicator’s values over multiple time periods.<br>The Mann-Kendall Test for Statistical Significance is used to evaluate the trend<br>over 4 to 10 periods of measure, subject to data availability and comparability.
Cancer Plan Target
(4.1%)
State: Hawaii Adults with Hepatitis B Vaccines
State: Hawaii Adults with Hepatitis B Vaccines
37.9%
(2022)
Compared to:
Prior Value
(37.8%)
Prior Value compares a measured value with the previously measured value. Confidence intervals were taken into account in determining the direction of the comparison.
Trend
This comparison measures the indicator’s values over multiple time periods.<br>The Mann-Kendall Test for Statistical Significance is used to evaluate the trend<br>over 4 to 10 periods of measure, subject to data availability and comparability.
Cancer Plan Target
(44.7%)
State: Hawaii Adults with Sunburns, past year
State: Hawaii Adults with Sunburns, past year
32.2%
(2022)
Compared to:
Prior Value
(29.8%)
Prior Value compares a measured value with the previously measured value. Confidence intervals were taken into account in determining the direction of the comparison.
Trend
This comparison measures the indicator’s values over multiple time periods.<br>The Mann-Kendall Test for Statistical Significance is used to evaluate the trend<br>over 4 to 10 periods of measure, subject to data availability and comparability.
Cancer Plan Target
(33.1%)
State: Hawaii All Cancer Incidence Rate
State: Hawaii All Cancer Incidence Rate
413.9
Cases per 100,000 population
(2016-2020)
Compared to:

U.S. States
The distribution is based on data from 48 U.S. states and the District of Columbia.
US Value
(442.3)
The regional value is compared to the national value.
Prior Value
(416.8)
Prior Value compares a measured value with the previously measured value. Confidence intervals were taken into account in determining the direction of the comparison.
Trend
This comparison measures the indicator’s values over multiple time periods.<br>The Mann-Kendall Test for Statistical Significance is used to evaluate the trend<br>over 4 to 10 periods of measure, subject to data availability and comparability.
State: Hawaii Bladder Cancer Incidence Rate
State: Hawaii Bladder Cancer Incidence Rate
13.5
Cases per 100,000 population
(2016-2020)
Compared to:
U.S. States
The distribution is based on data from 48 U.S. states and the District of Columbia.
US Value
(18.9)
The regional value is compared to the national value.
Prior Value
(13.8)
Prior Value compares a measured value with the previously measured value. Confidence intervals were taken into account in determining the direction of the comparison.
Trend
This comparison measures the indicator’s values over multiple time periods.<br>The Mann-Kendall Test for Statistical Significance is used to evaluate the trend<br>over 4 to 10 periods of measure, subject to data availability and comparability.
State: Hawaii Brain Cancer Incidence Rate
State: Hawaii Brain Cancer Incidence Rate
4.3
Per 100,000 population
(2016-2020)
Compared to:
US Value
(6.4)
The regional value is compared to the national value.
Prior Value
(4.2)
Prior Value compares a measured value with the previously measured value. Confidence intervals were taken into account in determining the direction of the comparison.
Trend
This comparison measures the indicator’s values over multiple time periods.<br>The Mann-Kendall Test for Statistical Significance is used to evaluate the trend<br>over 4 to 10 periods of measure, subject to data availability and comparability.
State: Hawaii Breast Cancer Death Rate
State: Hawaii Breast Cancer Death Rate
18.1
Deaths per 100,000 females
(2022)
Compared to:
US Value
(19.4 in 2021)
The regional value is compared to the national value.
Prior Value
(15.3)
Prior Value compares a measured value with the previously measured value. Confidence intervals were taken into account in determining the direction of the comparison.
Trend
This comparison measures the indicator’s values over multiple time periods.<br>The Mann-Kendall Test for Statistical Significance is used to evaluate the trend<br>over 4 to 10 periods of measure, subject to data availability and comparability.
Cancer Plan Target
(13.5)
HP 2030 Target
(15.3)
<div>
<div>C-04: Reduce the female breast cancer death rate</div>
<div> </div>
<p>The national indicator definition and data source are the same as for the state.</p>
</div>
State: Hawaii Breast Cancer Incidence Rate
State: Hawaii Breast Cancer Incidence Rate
140.2
Cases per 100,000 females
(2016-2020)
Compared to:

U.S. States
The distribution is based on data from 48 U.S. states and the District of Columbia.
US Value
(127.0)
The regional value is compared to the national value.
Prior Value
(140.2)
Prior Value compares a measured value with the previously measured value. Confidence intervals were taken into account in determining the direction of the comparison.
Trend
This comparison measures the indicator’s values over multiple time periods.<br>The Mann-Kendall Test for Statistical Significance is used to evaluate the trend<br>over 4 to 10 periods of measure, subject to data availability and comparability.
Cancer Plan Target
(122.8)
State: Hawaii Breast Cancer Screening
State: Hawaii Breast Cancer Screening
78.5%
(2022)
Compared to:

Median Value for States and Territories
(76.3%)
The regional value is compared to the median value for states and territories.
Prior Value
(83.7%)
Prior Value compares a measured value with the previously measured value. Confidence intervals were taken into account in determining the direction of the comparison.
Trend
This comparison measures the indicator’s values over multiple time periods.<br>The Mann-Kendall Test for Statistical Significance is used to evaluate the trend<br>over 4 to 10 periods of measure, subject to data availability and comparability.
Cancer Plan Target
(92.1%)
HP 2030 Target
(80.5%)
<div>
<div>C-05: Increase the proportion of females who get screened for breast cancer</div>
<div> </div>
<div>The national indicator is defined in exactly the same way. The data source for the national indicator is the National Health Interview Survey, from which state-level data for Hawaii cannot be obtained. The state data source is the Behavioral Risk Factor Surveillance System, which is comparable to the national data source.</div>
</div>
State: Hawaii Cancer Death Rate
State: Hawaii Cancer Death Rate
118.2
Deaths per 100,000 population
(2022)
Compared to:
US Value
(146.4 in 2021)
The regional value is compared to the national value.
Prior Value
(119.5)
Prior Value compares a measured value with the previously measured value. Confidence intervals were taken into account in determining the direction of the comparison.
Trend
This comparison measures the indicator’s values over multiple time periods.<br>The Mann-Kendall Test for Statistical Significance is used to evaluate the trend<br>over 4 to 10 periods of measure, subject to data availability and comparability.
Cancer Plan Target
(107.5)
HP 2030 Target
(122.7)
<div>
<div><span class="bold"><span>C-1: </span></span><span>Reduce the overall cancer death rate</span></div>
<div><span> </span></div>
<div><span>The </span>national indicator definition and data source are the same as for the state.</div>
</div>
State: Hawaii Cancer Survivors Who Have Obesity
State: Hawaii Cancer Survivors Who Have Obesity
21.3%
(2022)
Compared to:
Prior Value
(20.6%)
Prior Value compares a measured value with the previously measured value. Confidence intervals were taken into account in determining the direction of the comparison.
Trend
This comparison measures the indicator’s values over multiple time periods.<br>The Mann-Kendall Test for Statistical Significance is used to evaluate the trend<br>over 4 to 10 periods of measure, subject to data availability and comparability.
Cancer Plan Target
(19.5%)
State: Hawaii Cancer Survivors Who Smoke Cigarettes or E-cigarettes
State: Hawaii Cancer Survivors Who Smoke Cigarettes or E-cigarettes
10.0%
(2022)
Compared to:
Prior Value
(9.6%)
Prior Value compares a measured value with the previously measured value. Confidence intervals were taken into account in determining the direction of the comparison.
Trend
This comparison measures the indicator’s values over multiple time periods.<br>The Mann-Kendall Test for Statistical Significance is used to evaluate the trend<br>over 4 to 10 periods of measure, subject to data availability and comparability.
Cancer Plan Target
(8.6%)
State: Hawaii Cancer Survivors with a Survivorship Care Plan
State: Hawaii Cancer Survivors with a Survivorship Care Plan
27.5%
(2019)
Compared to:
Prior Value
(32.1%)
Prior Value compares a measured value with the previously measured value. Confidence intervals were taken into account in determining the direction of the comparison.
Cancer Plan Target
(30.5%)
State: Hawaii Cancer Survivors with a Written Treatment Summary
State: Hawaii Cancer Survivors with a Written Treatment Summary
52.7%
(2022)
Compared to:
Prior Value
(49.0%)
Prior Value compares a measured value with the previously measured value. Confidence intervals were taken into account in determining the direction of the comparison.
Trend
This comparison measures the indicator’s values over multiple time periods.<br>The Mann-Kendall Test for Statistical Significance is used to evaluate the trend<br>over 4 to 10 periods of measure, subject to data availability and comparability.
Cancer Plan Target
(59.7%)
State: Hawaii Cancer Survivors with an Advance Directive
State: Hawaii Cancer Survivors with an Advance Directive
65.8%
(2021)
Compared to:
Prior Value
(63.5%)
Prior Value compares a measured value with the previously measured value. Confidence intervals were taken into account in determining the direction of the comparison.
Trend
This comparison measures the indicator’s values over multiple time periods.<br>The Mann-Kendall Test for Statistical Significance is used to evaluate the trend<br>over 4 to 10 periods of measure, subject to data availability and comparability.
Cancer Plan Target
(70.5%)
State: Hawaii Cancer Survivors with Instructions for Follow Up Care
State: Hawaii Cancer Survivors with Instructions for Follow Up Care
81.1%
(2022)
Compared to:
Prior Value
(76.6%)
Prior Value compares a measured value with the previously measured value. Confidence intervals were taken into account in determining the direction of the comparison.
Trend
This comparison measures the indicator’s values over multiple time periods.<br>The Mann-Kendall Test for Statistical Significance is used to evaluate the trend<br>over 4 to 10 periods of measure, subject to data availability and comparability.
Cancer Plan Target
(82.8%)
State: Hawaii Cancer: Medicare Population
State: Hawaii Cancer: Medicare Population
11.0%
(2022)
Compared to:

U.S. States
The distribution is based on data from 50 U.S. states and the District of Columbia.
US Value
(12.0%)
The regional value is compared to the national value.
Prior Value
(11.0%)
Prior Value compares a measured value with the previously measured value. Confidence intervals were not taken into account in determining the direction of the comparison.
Trend
This comparison measures the indicator’s values over multiple time periods.<br>The Mann-Kendall Test for Statistical Significance is used to evaluate the trend<br>over 4 to 10 periods of measure, subject to data availability and comparability.
State: Hawaii Cervical Cancer Incidence Rate
State: Hawaii Cervical Cancer Incidence Rate
6.9
Cases per 100,000 females
(2016-2020)
Compared to:
U.S. States
The distribution is based on data from 48 U.S. states and the District of Columbia.
US Value
(7.5)
The regional value is compared to the national value.
Prior Value
(6.8)
Prior Value compares a measured value with the previously measured value. Confidence intervals were taken into account in determining the direction of the comparison.
Trend
This comparison measures the indicator’s values over multiple time periods.<br>The Mann-Kendall Test for Statistical Significance is used to evaluate the trend<br>over 4 to 10 periods of measure, subject to data availability and comparability.
Cancer Plan Target
(6.1)
State: Hawaii Cervical Cancer Screening
State: Hawaii Cervical Cancer Screening
80.2%
(2020)
Compared to:
Prior Value
(87.1%)
Prior Value compares a measured value with the previously measured value. Confidence intervals were taken into account in determining the direction of the comparison.
Trend
This comparison measures the indicator’s values over multiple time periods.<br>The Mann-Kendall Test for Statistical Significance is used to evaluate the trend<br>over 4 to 10 periods of measure, subject to data availability and comparability.
Cancer Plan Target
(84.3%)
HP 2030 Target
(84.3%)
<div>
<div>C-09: Increase the proportion of females who get screened for cervical cancer.<br /> </div>
<div>The national indicator is defined in exactly the same way. The data source for the national indicator is the National Health Interview Survey, from which state-level data for Hawaii cannot be obtained. The state data source is the Behavioral Risk Factor Surveillance System, which is comparable to the national data source.</div>
</div>
State: Hawaii Childhood Cancer Incidence Rate
State: Hawaii Childhood Cancer Incidence Rate
16.5
Cases per 100,000 population 0-19
(2016-2020)
Compared to:
U.S. States
The distribution is based on data from 48 U.S. states and the District of Columbia.
US Value
(18.8)
The regional value is compared to the national value.
Prior Value
(16.8)
Prior Value compares a measured value with the previously measured value. Confidence intervals were taken into account in determining the direction of the comparison.
Trend
This comparison measures the indicator’s values over multiple time periods.<br>The Mann-Kendall Test for Statistical Significance is used to evaluate the trend<br>over 4 to 10 periods of measure, subject to data availability and comparability.
State: Hawaii Colorectal Cancer Death Rate
State: Hawaii Colorectal Cancer Death Rate
12.1
Deaths per 100,000 population
(2022)
Compared to:
US Value
(13.4 in 2021)
The regional value is compared to the national value.
Prior Value
(12.3)
Prior Value compares a measured value with the previously measured value. Confidence intervals were taken into account in determining the direction of the comparison.
Trend
This comparison measures the indicator’s values over multiple time periods.<br>The Mann-Kendall Test for Statistical Significance is used to evaluate the trend<br>over 4 to 10 periods of measure, subject to data availability and comparability.
Cancer Plan Target
(8.9)
HP 2030 Target
(8.9)
<div>
<div>C-06: Reduce the colorectal cancer death rate</div>
<div> </div>
<p>The national indicator definition and data source are the same as for the state.</p>
</div>
State: Hawaii Colorectal Cancer Incidence Rate
State: Hawaii Colorectal Cancer Incidence Rate
38.8
Cases per 100,000 population
(2016-2020)
Compared to:
U.S. States
The distribution is based on data from 48 U.S. states and the District of Columbia.
US Value
(36.5)
The regional value is compared to the national value.
Prior Value
(39.4)
Prior Value compares a measured value with the previously measured value. Confidence intervals were taken into account in determining the direction of the comparison.
Trend
This comparison measures the indicator’s values over multiple time periods.<br>The Mann-Kendall Test for Statistical Significance is used to evaluate the trend<br>over 4 to 10 periods of measure, subject to data availability and comparability.
Cancer Plan Target
(35.3)
State: Hawaii Colorectal Cancer Screening
State: Hawaii Colorectal Cancer Screening
77.1%
(2020)
Compared to:
Median Value for States and Territories
(74.2%)
The regional value is compared to the median value for states and territories.
Prior Value
(75.1%)
Prior Value compares a measured value with the previously measured value. Confidence intervals were taken into account in determining the direction of the comparison.
Trend
This comparison measures the indicator’s values over multiple time periods.<br>The Mann-Kendall Test for Statistical Significance is used to evaluate the trend<br>over 4 to 10 periods of measure, subject to data availability and comparability.
Cancer Plan Target
(84.8%)
HP 2030 Target
(74.4%)
<div>
<div>C-07: Increase the proportion of adults who get screened for colorectal cancer <strong>(LEADING HEALTH INDICATOR)</strong></div>
<div> </div>
<div>The national indicator is defined in exactly the same way. The data source for the national indicator is the National Health Interview Survey, from which state-level data for Hawaii cannot be obtained. The state data source is the Behavioral Risk Factor Surveillance System, which is comparable to the national data source.</div>
</div>
State: Hawaii Five-Year Cancer Survivorship
State: Hawaii Five-Year Cancer Survivorship
64.9%
(2022)
Compared to:
Prior Value
(69.1%)
Prior Value compares a measured value with the previously measured value. Confidence intervals were taken into account in determining the direction of the comparison.
Trend
This comparison measures the indicator’s values over multiple time periods.<br>The Mann-Kendall Test for Statistical Significance is used to evaluate the trend<br>over 4 to 10 periods of measure, subject to data availability and comparability.
Cancer Plan Target
(66.2%)
HP 2030 Target
(66.2%)
<div><span>C-11: Increase the proportion of cancer survivors who are living 5 years or longer after diagnosis </span></div>
<div><span></span></div>
<div><span>The national indicator is defined in exactly the same way. The data source for the national indicator is the Surveillance, Epidemiology, and End Results Program (SEER). The data source for the state is the Behavioral Risk Factor Surveillance System, which is comparable to the national data source.</span></div>
State: Hawaii Liver and Bile Duct Cancer Incidence Rate
State: Hawaii Liver and Bile Duct Cancer Incidence Rate
9.8
Cases per 100,000 population
(2016-2020)
Compared to:
U.S. States
The distribution is based on data from 48 U.S. states and the District of Columbia.
US Value
(8.6)
The regional value is compared to the national value.
Prior Value
(10.2)
Prior Value compares a measured value with the previously measured value. Confidence intervals were taken into account in determining the direction of the comparison.
Trend
This comparison measures the indicator’s values over multiple time periods.<br>The Mann-Kendall Test for Statistical Significance is used to evaluate the trend<br>over 4 to 10 periods of measure, subject to data availability and comparability.
Cancer Plan Target
(9.3)
State: Hawaii Liver or Bile Duct Cancer Death Rate
State: Hawaii Liver or Bile Duct Cancer Death Rate
6.2
Deaths per 100,000 population
(2022)
Compared to:
US Value
(6.7 in 2021)
The regional value is compared to the national value.
Prior Value
(7.8)
Prior Value compares a measured value with the previously measured value. Confidence intervals were taken into account in determining the direction of the comparison.
Trend
This comparison measures the indicator’s values over multiple time periods.<br>The Mann-Kendall Test for Statistical Significance is used to evaluate the trend<br>over 4 to 10 periods of measure, subject to data availability and comparability.
Cancer Plan Target
(9.3)
State: Hawaii Lung and Bronchus Cancer Incidence Rate
State: Hawaii Lung and Bronchus Cancer Incidence Rate
41.7
Cases per 100,000 population
(2016-2020)
Compared to:
U.S. States
The distribution is based on data from 48 U.S. states and the District of Columbia.
US Value
(54.0)
The regional value is compared to the national value.
Prior Value
(43.4)
Prior Value compares a measured value with the previously measured value. Confidence intervals were taken into account in determining the direction of the comparison.
Trend
This comparison measures the indicator’s values over multiple time periods.<br>The Mann-Kendall Test for Statistical Significance is used to evaluate the trend<br>over 4 to 10 periods of measure, subject to data availability and comparability.
Cancer Plan Target
(38.3)
State: Hawaii Lung Cancer Death Rate
State: Hawaii Lung Cancer Death Rate
21.9
Deaths per 100,000 population
(2022)
Compared to:
US Value
(31.7 in 2021)
The regional value is compared to the national value.
Prior Value
(22.3)
Prior Value compares a measured value with the previously measured value. Confidence intervals were taken into account in determining the direction of the comparison.
Trend
This comparison measures the indicator’s values over multiple time periods.<br>The Mann-Kendall Test for Statistical Significance is used to evaluate the trend<br>over 4 to 10 periods of measure, subject to data availability and comparability.
Cancer Plan Target
(20.3)
HP 2030 Target
(25.1)
<div>
<div><span class="bold"><span>C-02: </span></span><span>Reduce the lung cancer death rate</span></div>
<div><span> </span></div>
<div><span>The </span>national indicator definition and data source are the same as for the state.</div>
</div>
State: Hawaii Mammography Screening: Medicare Population
State: Hawaii Mammography Screening: Medicare Population
44.0%
(2022)
Compared to:

U.S. States
The distribution is based on data from 50 U.S. states and the District of Columbia.
US Value
(47.0%)
The regional value is compared to the national value.
Prior Value
(42.0%)
Prior Value compares a measured value with the previously measured value. Confidence intervals were not taken into account in determining the direction of the comparison.
Trend
This comparison measures the indicator’s values over multiple time periods.<br>The Mann-Kendall Test for Statistical Significance is used to evaluate the trend<br>over 4 to 10 periods of measure, subject to data availability and comparability.
State: Hawaii Melanoma Cancer Death Rate
State: Hawaii Melanoma Cancer Death Rate
1.2
Deaths per 100,000 population
(2018-2022)
Compared to:
US Value
(2.0 in 2021)
The regional value is compared to the national value.
Prior Value
(1.2)
Prior Value compares a measured value with the previously measured value. Confidence intervals were taken into account in determining the direction of the comparison.
Trend
This comparison measures the indicator’s values over multiple time periods.<br>The Mann-Kendall Test for Statistical Significance is used to evaluate the trend<br>over 4 to 10 periods of measure, subject to data availability and comparability.
Cancer Plan Target
(1.1)
State: Hawaii Melanoma Incidence Rate
State: Hawaii Melanoma Incidence Rate
24.4
Cases per 100,000 population
(2016-2020)
Compared to:
U.S. States
The distribution is based on data from 48 U.S. states and the District of Columbia.
US Value
(22.5)
The regional value is compared to the national value.
Prior Value
(24.0)
Prior Value compares a measured value with the previously measured value. Confidence intervals were taken into account in determining the direction of the comparison.
Trend
This comparison measures the indicator’s values over multiple time periods.<br>The Mann-Kendall Test for Statistical Significance is used to evaluate the trend<br>over 4 to 10 periods of measure, subject to data availability and comparability.
Cancer Plan Target
(20.2)
State: Hawaii Men 40+ Who Had a PSA Test
State: Hawaii Men 40+ Who Had a PSA Test
25.4%
(2020)
Compared to:
Median Value for States and Territories
(31.8% in 2022)
The regional value is compared to the median value for states and territories.
Prior Value
(24.5%)
Prior Value compares a measured value with the previously measured value. Confidence intervals were taken into account in determining the direction of the comparison.
Trend
This comparison measures the indicator’s values over multiple time periods.<br>The Mann-Kendall Test for Statistical Significance is used to evaluate the trend<br>over 4 to 10 periods of measure, subject to data availability and comparability.
Cancer Plan Target
(27.9%)
State: Hawaii Men Who Have Discussed PSA Test with Doctor
State: Hawaii Men Who Have Discussed PSA Test with Doctor
14.7%
(2020)
Compared to:
Prior Value
(15.6%)
Prior Value compares a measured value with the previously measured value. Confidence intervals were taken into account in determining the direction of the comparison.
Trend
This comparison measures the indicator’s values over multiple time periods.<br>The Mann-Kendall Test for Statistical Significance is used to evaluate the trend<br>over 4 to 10 periods of measure, subject to data availability and comparability.
Cancer Plan Target
(16.2%)
State: Hawaii Non-Hodgkin Lymphoma Incidence Rate
State: Hawaii Non-Hodgkin Lymphoma Incidence Rate
14.9
Cases per 100,000 population
(2016-2020)
Compared to:
U.S. States
The distribution is based on data from 48 U.S. states and the District of Columbia.
US Value
(18.6)
The regional value is compared to the national value.
Prior Value
(15.2)
Prior Value compares a measured value with the previously measured value. Confidence intervals were taken into account in determining the direction of the comparison.
Trend
This comparison measures the indicator’s values over multiple time periods.<br>The Mann-Kendall Test for Statistical Significance is used to evaluate the trend<br>over 4 to 10 periods of measure, subject to data availability and comparability.
State: Hawaii Oral Cavity and Pharynx Cancer Incidence Rate
State: Hawaii Oral Cavity and Pharynx Cancer Incidence Rate
13.0
Cases per 100,000 population
(2016-2020)
Compared to:
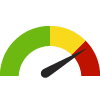
U.S. States
The distribution is based on data from 48 U.S. states and the District of Columbia.
US Value
(11.9)
The regional value is compared to the national value.
Prior Value
(13.0)
Prior Value compares a measured value with the previously measured value. Confidence intervals were taken into account in determining the direction of the comparison.
Trend
This comparison measures the indicator’s values over multiple time periods.<br>The Mann-Kendall Test for Statistical Significance is used to evaluate the trend<br>over 4 to 10 periods of measure, subject to data availability and comparability.
State: Hawaii Oropharyngeal Cancer Death Rate
State: Hawaii Oropharyngeal Cancer Death Rate
2.7
Deaths per 100,000 population
(2020-2022)
Compared to:
US Value
(2.7 in 2021)
The regional value is compared to the national value.
Prior Value
(2.8)
Prior Value compares a measured value with the previously measured value. Confidence intervals were taken into account in determining the direction of the comparison.
Trend
This comparison measures the indicator’s values over multiple time periods.<br>The Mann-Kendall Test for Statistical Significance is used to evaluate the trend<br>over 4 to 10 periods of measure, subject to data availability and comparability.
Cancer Plan Target
(2.6)
State: Hawaii Ovarian Cancer Incidence Rate
State: Hawaii Ovarian Cancer Incidence Rate
9.2
Cases per 100,000 females
(2016-2020)
Compared to:
U.S. States
The distribution is based on data from 48 U.S. states and the District of Columbia.
US Value
(10.1)
The regional value is compared to the national value.
Prior Value
(9.4)
Prior Value compares a measured value with the previously measured value. Confidence intervals were taken into account in determining the direction of the comparison.
Trend
This comparison measures the indicator’s values over multiple time periods.<br>The Mann-Kendall Test for Statistical Significance is used to evaluate the trend<br>over 4 to 10 periods of measure, subject to data availability and comparability.
State: Hawaii Pancreatic Cancer Incidence Rate
State: Hawaii Pancreatic Cancer Incidence Rate
13.5
Cases per 100,000 population
(2016-2020)
Compared to:
U.S. States
The distribution is based on data from 48 U.S. states and the District of Columbia.
US Value
(13.2)
The regional value is compared to the national value.
Prior Value
(13.6)
Prior Value compares a measured value with the previously measured value. Confidence intervals were taken into account in determining the direction of the comparison.
Trend
This comparison measures the indicator’s values over multiple time periods.<br>The Mann-Kendall Test for Statistical Significance is used to evaluate the trend<br>over 4 to 10 periods of measure, subject to data availability and comparability.
State: Hawaii Prostate Cancer Death Rate
State: Hawaii Prostate Cancer Death Rate
15.9
Deaths per 100,000 males
(2022)
Compared to:
US Value
(19.0 in 2021)
The regional value is compared to the national value.
Prior Value
(15.3)
Prior Value compares a measured value with the previously measured value. Confidence intervals were taken into account in determining the direction of the comparison.
Trend
This comparison measures the indicator’s values over multiple time periods.<br>The Mann-Kendall Test for Statistical Significance is used to evaluate the trend<br>over 4 to 10 periods of measure, subject to data availability and comparability.
Cancer Plan Target
(15.0)
HP 2030 Target
(16.9)
<div>
<div><span class="bold"><span>C-08: </span></span><span>Reduce the prostate cancer death rate</span></div>
<div><span> </span></div>
<div><span>The </span>national indicator definition and data source are the same as for the state.</div>
</div>
State: Hawaii Prostate Cancer Incidence Rate
State: Hawaii Prostate Cancer Incidence Rate
101.1
Cases per 100,000 males
(2016-2020)
Compared to:
U.S. States
The distribution is based on data from 48 U.S. states and the District of Columbia.
US Value
(110.5)
The regional value is compared to the national value.
Prior Value
(100.3)
Prior Value compares a measured value with the previously measured value. Confidence intervals were taken into account in determining the direction of the comparison.
Trend
This comparison measures the indicator’s values over multiple time periods.<br>The Mann-Kendall Test for Statistical Significance is used to evaluate the trend<br>over 4 to 10 periods of measure, subject to data availability and comparability.
Cancer Plan Target
(84.1)
State: Hawaii Teens Who Use Sunscreen
State: Hawaii Teens Who Use Sunscreen
16.1%
(2021)
Compared to:
US Value
(84.5% in 2019)
The regional value is compared to the national value.
Prior Value
(12.4%)
Prior Value compares a measured value with the previously measured value. Confidence intervals were taken into account in determining the direction of the comparison.
Trend
This comparison measures the indicator’s values over multiple time periods.<br>The Mann-Kendall Test for Statistical Significance is used to evaluate the trend<br>over 4 to 10 periods of measure, subject to data availability and comparability.
Cancer Plan Target
(13.8%)
State: Hawaii Uterine Cancer Incidence Rate
State: Hawaii Uterine Cancer Incidence Rate
34.4
Cases per 100,000 population
(2016-2020)
Compared to:
US Value
(27.4)
The regional value is compared to the national value.
Prior Value
(33.8)
Prior Value compares a measured value with the previously measured value. Confidence intervals were taken into account in determining the direction of the comparison.
Trend
This comparison measures the indicator’s values over multiple time periods.<br>The Mann-Kendall Test for Statistical Significance is used to evaluate the trend<br>over 4 to 10 periods of measure, subject to data availability and comparability.
State: Hawaii Women 21-65 Who Had a Pap Test
State: Hawaii Women 21-65 Who Had a Pap Test
76.1%
(2020)
Compared to:
Median Value for States and Territories
(77.7%)
The regional value is compared to the median value for states and territories.
Prior Value
(82.7%)
Prior Value compares a measured value with the previously measured value. Confidence intervals were taken into account in determining the direction of the comparison.
Trend
This comparison measures the indicator’s values over multiple time periods.<br>The Mann-Kendall Test for Statistical Significance is used to evaluate the trend<br>over 4 to 10 periods of measure, subject to data availability and comparability.
Cancer Plan Target
(83.7%)
State: Hawaii Women 30-65 Who Had an HPV Test
State: Hawaii Women 30-65 Who Had an HPV Test
44.8%
(2020)
Compared to:
Prior Value
(47.7%)
Prior Value compares a measured value with the previously measured value. Confidence intervals were taken into account in determining the direction of the comparison.
Trend
This comparison measures the indicator’s values over multiple time periods.<br>The Mann-Kendall Test for Statistical Significance is used to evaluate the trend<br>over 4 to 10 periods of measure, subject to data availability and comparability.
Cancer Plan Target
(49.3%)
State: Hawaii Young Teens Who Use Sunscreen
State: Hawaii Young Teens Who Use Sunscreen
13.9%
(2021)
Compared to:
Prior Value
(12.5%)
Prior Value compares a measured value with the previously measured value. Confidence intervals were taken into account in determining the direction of the comparison.
Cancer Plan Target
(13.9%)
State: Hawaii
Health / Children's Health
Value
Compared to:
State: Hawaii Children 3-17 with ADD/ADHD
State: Hawaii Children 3-17 with ADD/ADHD
5.9%
(2020-2021)
Compared to:
US Value
(9.5%)
The regional value is compared to the national value.
Prior Value
(5.4%)
Prior Value compares a measured value with the previously measured value. Confidence intervals were taken into account in determining the direction of the comparison.
Trend
This comparison measures the indicator’s values over multiple time periods.<br>The Mann-Kendall Test for Statistical Significance is used to evaluate the trend<br>over 4 to 10 periods of measure, subject to data availability and comparability.
45.8%
(2020-2021)
Compared to:
US Value
(45.3%)
The regional value is compared to the national value.
Prior Value
(53.7%)
Prior Value compares a measured value with the previously measured value. Confidence intervals were not taken into account in determining the direction of the comparison.
Trend
This comparison measures the indicator’s values over multiple time periods.<br>The Mann-Kendall Test for Statistical Significance is used to evaluate the trend<br>over 4 to 10 periods of measure, subject to data availability and comparability.
15.2%
(2020-2021)
Compared to:
US Value
(23.3%)
The regional value is compared to the national value.
Prior Value
(15.0%)
Prior Value compares a measured value with the previously measured value. Confidence intervals were taken into account in determining the direction of the comparison.
Trend
This comparison measures the indicator’s values over multiple time periods.<br>The Mann-Kendall Test for Statistical Significance is used to evaluate the trend<br>over 4 to 10 periods of measure, subject to data availability and comparability.
41.0%
(2020-2021)
Compared to:
US Value
(34.8%)
The regional value is compared to the national value.
Prior Value
(41.2%)
Prior Value compares a measured value with the previously measured value. Confidence intervals were taken into account in determining the direction of the comparison.
Trend
This comparison measures the indicator’s values over multiple time periods.<br>The Mann-Kendall Test for Statistical Significance is used to evaluate the trend<br>over 4 to 10 periods of measure, subject to data availability and comparability.
HP 2030 Target
(35.8%)
<div><span>MICH-17: Increase the proportion of children who receive a developmental screening<br /><br />The national indicator definition and data source are the same as for the state.</span></div>
State: Hawaii
Health / Diabetes
Value
Compared to:
State: Hawaii Adults with a Diabetes Self-Management Plan
State: Hawaii Adults with a Diabetes Self-Management Plan
62.9%
(2019)
Compared to:
Prior Value
(64.3%)
Prior Value compares a measured value with the previously measured value. Confidence intervals were taken into account in determining the direction of the comparison.
Diabetes Plan Target
(69.8%)
State: Hawaii Adults with Diabetes
State: Hawaii Adults with Diabetes
11.7%
(2022)
Compared to:
Median Value for States and Territories
(11.6%)
The regional value is compared to the median value for states and territories.
Prior Value
(9.5%)
Prior Value compares a measured value with the previously measured value. Confidence intervals were taken into account in determining the direction of the comparison.
Trend
This comparison measures the indicator’s values over multiple time periods.<br>The Mann-Kendall Test for Statistical Significance is used to evaluate the trend<br>over 4 to 10 periods of measure, subject to data availability and comparability.
State: Hawaii Adults with New Cases of Diabetes
State: Hawaii Adults with New Cases of Diabetes
7.4
New cases per 1,000 population
(2021)
Compared to:
US Value
(8.5)
The regional value is compared to the national value.
Prior Value
(8.1)
Prior Value compares a measured value with the previously measured value. Confidence intervals were taken into account in determining the direction of the comparison.
Trend
This comparison measures the indicator’s values over multiple time periods.<br>The Mann-Kendall Test for Statistical Significance is used to evaluate the trend<br>over 4 to 10 periods of measure, subject to data availability and comparability.
Diabetes Plan Target
(4.8)
HP 2030 LHI
(4.8)
<div><span>D-01: Reduce the number of diabetes cases diagnosed yearly <strong>(LEADING HEALTH INDICATOR)</strong><br /><br />The national indicator includes adults aged 18-84. The data source for the national indicator is the National Health Interview Survey, from which state-level data for Hawaiʻi cannot be obtained. The state data source is the US Diabetes Surveillance System, which is comparable to the national data source.</span></div>
State: Hawaii Adults with Prediabetes
State: Hawaii Adults with Prediabetes
15.0%
(2022)
Compared to:
Prior Value
(16.4%)
Prior Value compares a measured value with the previously measured value. Confidence intervals were taken into account in determining the direction of the comparison.
Trend
This comparison measures the indicator’s values over multiple time periods.<br>The Mann-Kendall Test for Statistical Significance is used to evaluate the trend<br>over 4 to 10 periods of measure, subject to data availability and comparability.
State: Hawaii Diabetes Death Rate
State: Hawaii Diabetes Death Rate
17.0
Deaths per 100,000 population
(2022)
Compared to:
US Value
(25.4 in 2021)
The regional value is compared to the national value.
Prior Value
(16.9)
Prior Value compares a measured value with the previously measured value. Confidence intervals were taken into account in determining the direction of the comparison.
Trend
This comparison measures the indicator’s values over multiple time periods.<br>The Mann-Kendall Test for Statistical Significance is used to evaluate the trend<br>over 4 to 10 periods of measure, subject to data availability and comparability.
State: Hawaii Diabetes Death Rate (Multiple Cause of Death)
State: Hawaii Diabetes Death Rate (Multiple Cause of Death)
66.9
Deaths per 100,000 population
(2021)
Compared to:
US Value
(98.1)
The regional value is compared to the national value.
Prior Value
(62.2)
Prior Value compares a measured value with the previously measured value. Confidence intervals were taken into account in determining the direction of the comparison.
Trend
This comparison measures the indicator’s values over multiple time periods.<br>The Mann-Kendall Test for Statistical Significance is used to evaluate the trend<br>over 4 to 10 periods of measure, subject to data availability and comparability.
Diabetes Plan Target
(56.0)
State: Hawaii Diabetes: Medicare Population
State: Hawaii Diabetes: Medicare Population
27.0%
(2022)
Compared to:
U.S. States
The distribution is based on data from 50 U.S. states and the District of Columbia.
US Value
(24.0%)
The regional value is compared to the national value.
Prior Value
(26.0%)
Prior Value compares a measured value with the previously measured value. Confidence intervals were not taken into account in determining the direction of the comparison.
Trend
This comparison measures the indicator’s values over multiple time periods.<br>The Mann-Kendall Test for Statistical Significance is used to evaluate the trend<br>over 4 to 10 periods of measure, subject to data availability and comparability.
State: Hawaii High Risk Adults Tested for Diabetes
State: Hawaii High Risk Adults Tested for Diabetes
86.9
(2022)
Compared to:
Prior Value
(53.2)
Prior Value compares a measured value with the previously measured value. Confidence intervals were taken into account in determining the direction of the comparison.
Trend
This comparison measures the indicator’s values over multiple time periods.<br>The Mann-Kendall Test for Statistical Significance is used to evaluate the trend<br>over 4 to 10 periods of measure, subject to data availability and comparability.
Diabetes Plan Target
(67.5)
State: Hawaii Hospitalization for Diabetes among Adults 65+
State: Hawaii Hospitalization for Diabetes among Adults 65+
282.1
Hospitalizations per 100,000 population 65+ yrs
(2022)
Compared to:
Prior Value
(235.0)
Prior Value compares a measured value with the previously measured value. Confidence intervals were taken into account in determining the direction of the comparison.
Trend
This comparison measures the indicator’s values over multiple time periods.<br>The Mann-Kendall Test for Statistical Significance is used to evaluate the trend<br>over 4 to 10 periods of measure, subject to data availability and comparability.
HP 2030 Target
(264)
<div><span>OA-05: Reduce the rate of hospital admissions for diabetes among older adults<br /><br />The national indicator is defined in exactly the same way. The data source for the national indictor is the Healthcare Cost and Utilization Project. The state data source is Laulima, which is comparable to the national data source.</span></div>
State: Hawaii
Health / Disabilities
Value
Compared to:
State: Hawaii Adults with a Cognitive Disability
State: Hawaii Adults with a Cognitive Disability
9.1%
(2022)
Compared to:
Median Value for States and Territories
(13.4%)
The regional value is compared to the median value for states and territories.
Prior Value
(8.0%)
Prior Value compares a measured value with the previously measured value. Confidence intervals were taken into account in determining the direction of the comparison.
Trend
This comparison measures the indicator’s values over multiple time periods.<br>The Mann-Kendall Test for Statistical Significance is used to evaluate the trend<br>over 4 to 10 periods of measure, subject to data availability and comparability.
State: Hawaii Adults with a Disability
State: Hawaii Adults with a Disability
24.1%
(2022)
Compared to:
Median Value for States and Territories
(27.6% in 2019)
The regional value is compared to the median value for states and territories.
Prior Value
(22.5%)
Prior Value compares a measured value with the previously measured value. Confidence intervals were taken into account in determining the direction of the comparison.
Trend
This comparison measures the indicator’s values over multiple time periods.<br>The Mann-Kendall Test for Statistical Significance is used to evaluate the trend<br>over 4 to 10 periods of measure, subject to data availability and comparability.
State: Hawaii Adults with a Self-Care Disability
State: Hawaii Adults with a Self-Care Disability
2.2%
(2022)
Compared to:
Median Value for States and Territories
(3.5%)
The regional value is compared to the median value for states and territories.
Prior Value
(2.3%)
Prior Value compares a measured value with the previously measured value. Confidence intervals were taken into account in determining the direction of the comparison.
Trend
This comparison measures the indicator’s values over multiple time periods.<br>The Mann-Kendall Test for Statistical Significance is used to evaluate the trend<br>over 4 to 10 periods of measure, subject to data availability and comparability.
State: Hawaii Adults with a Vision Disability
State: Hawaii Adults with a Vision Disability
4.0%
(2022)
Compared to:
Median Value for States and Territories
(5.3%)
The regional value is compared to the median value for states and territories.
Prior Value
(3.3%)
Prior Value compares a measured value with the previously measured value. Confidence intervals were taken into account in determining the direction of the comparison.
Trend
This comparison measures the indicator’s values over multiple time periods.<br>The Mann-Kendall Test for Statistical Significance is used to evaluate the trend<br>over 4 to 10 periods of measure, subject to data availability and comparability.
State: Hawaii Adults with Activity Limitations due to Arthritis
State: Hawaii Adults with Activity Limitations due to Arthritis
35.5%
(2021)
Compared to:
Median Value for States and Territories
(41.4%)
The regional value is compared to the median value for states and territories.
Prior Value
(33.1%)
Prior Value compares a measured value with the previously measured value. Confidence intervals were taken into account in determining the direction of the comparison.
Trend
This comparison measures the indicator’s values over multiple time periods.<br>The Mann-Kendall Test for Statistical Significance is used to evaluate the trend<br>over 4 to 10 periods of measure, subject to data availability and comparability.
HP 2030 Target
(38.7%)
<div><span>A-02: Reduce the proportion of adults with arthritis whose arthritis limits their activities<br /> <br />The national indicator is defined in exactly the same way. The data source for the national indicator is the National Health Interview Survey, from which state-level data for Hawaii cannot be obtained. The state data source is the Behavioral Risk Factor Surveillance System, which is comparable to the national data source.</span></div>
State: Hawaii Adults with an Ambulatory Disability
State: Hawaii Adults with an Ambulatory Disability
10.7%
(2022)
Compared to:
Median Value for States and Territories
(13.3%)
The regional value is compared to the median value for states and territories.
Prior Value
(9.7%)
Prior Value compares a measured value with the previously measured value. Confidence intervals were taken into account in determining the direction of the comparison.
Trend
This comparison measures the indicator’s values over multiple time periods.<br>The Mann-Kendall Test for Statistical Significance is used to evaluate the trend<br>over 4 to 10 periods of measure, subject to data availability and comparability.
State: Hawaii Adults with an Independent Living Disability
State: Hawaii Adults with an Independent Living Disability
5.7%
(2022)
Compared to:
Median Value for States and Territories
(7.6%)
The regional value is compared to the median value for states and territories.
Prior Value
(5.0%)
Prior Value compares a measured value with the previously measured value. Confidence intervals were taken into account in determining the direction of the comparison.
Trend
This comparison measures the indicator’s values over multiple time periods.<br>The Mann-Kendall Test for Statistical Significance is used to evaluate the trend<br>over 4 to 10 periods of measure, subject to data availability and comparability.
State: Hawaii Adults with Work Limitations due to Arthritis
State: Hawaii Adults with Work Limitations due to Arthritis
27.9%
(2021)
Compared to:
Median Value for States and Territories
(29.9%)
The regional value is compared to the median value for states and territories.
Prior Value
(31.3%)
Prior Value compares a measured value with the previously measured value. Confidence intervals were taken into account in determining the direction of the comparison.
Trend
This comparison measures the indicator’s values over multiple time periods.<br>The Mann-Kendall Test for Statistical Significance is used to evaluate the trend<br>over 4 to 10 periods of measure, subject to data availability and comparability.
HP 2030 Target
(34.7%)
<div><span>A-03: Reduce the proportion of adults with arthritis whose arthritis limits their work<br /> <br />The national indicator is limited to adults aged 18-64. The data source for the national indicator is the National Health Interview Survey, from which state-level data for Hawaii cannot be obtained. The state data source is the Behavioral Risk Factor Surveillance System, which is comparable to the national data source.</span></div>
State: Hawaii Children with a Disability
State: Hawaii Children with a Disability
3.4%
(2018-2022)
Compared to:


US Value
(4.5%)
The regional value is compared to the national value.
Trend
This comparison measures the indicator’s values over multiple time periods.<br>The Mann-Kendall Test for Statistical Significance is used to evaluate the trend<br>over 4 to 10 periods of measure, subject to data availability and comparability.
State: Hawaii Employment Among Persons with Disabilities
State: Hawaii Employment Among Persons with Disabilities
29.0%
(2012)
Compared to:
Prior Value
(42.1%)
Prior Value compares a measured value with the previously measured value. Confidence intervals were not taken into account in determining the direction of the comparison.
State: Hawaii Persons with a Cognitive Difficulty
State: Hawaii Persons with a Cognitive Difficulty
4.9%
(2018-2022)
Compared to:

US Value
(5.3%)
The regional value is compared to the national value.
Trend
This comparison measures the indicator’s values over multiple time periods.<br>The Mann-Kendall Test for Statistical Significance is used to evaluate the trend<br>over 4 to 10 periods of measure, subject to data availability and comparability.
State: Hawaii Persons with a Disability
State: Hawaii Persons with a Disability
12.0%
(2018-2022)
Compared to:
US Value
(12.9%)
The regional value is compared to the national value.
Trend
This comparison measures the indicator’s values over multiple time periods.<br>The Mann-Kendall Test for Statistical Significance is used to evaluate the trend<br>over 4 to 10 periods of measure, subject to data availability and comparability.
State: Hawaii Persons with a Hearing Difficulty
State: Hawaii Persons with a Hearing Difficulty
3.8%
(2018-2022)
Compared to:

US Value
(3.6%)
The regional value is compared to the national value.
Trend
This comparison measures the indicator’s values over multiple time periods.<br>The Mann-Kendall Test for Statistical Significance is used to evaluate the trend<br>over 4 to 10 periods of measure, subject to data availability and comparability.
State: Hawaii Persons with a Self-Care Difficulty
State: Hawaii Persons with a Self-Care Difficulty
2.5%
(2018-2022)
Compared to:

US Value
(2.6%)
The regional value is compared to the national value.
Trend
This comparison measures the indicator’s values over multiple time periods.<br>The Mann-Kendall Test for Statistical Significance is used to evaluate the trend<br>over 4 to 10 periods of measure, subject to data availability and comparability.
State: Hawaii Persons with a Vision Difficulty
State: Hawaii Persons with a Vision Difficulty
2.0%
(2018-2022)
Compared to:
US Value
(2.4%)
The regional value is compared to the national value.
Trend
This comparison measures the indicator’s values over multiple time periods.<br>The Mann-Kendall Test for Statistical Significance is used to evaluate the trend<br>over 4 to 10 periods of measure, subject to data availability and comparability.
State: Hawaii Persons with an Ambulatory Difficulty
State: Hawaii Persons with an Ambulatory Difficulty
6.4%
(2018-2022)
Compared to:
US Value
(6.7%)
The regional value is compared to the national value.
Trend
This comparison measures the indicator’s values over multiple time periods.<br>The Mann-Kendall Test for Statistical Significance is used to evaluate the trend<br>over 4 to 10 periods of measure, subject to data availability and comparability.
State: Hawaii Unemployment Among Persons with Disabilities
State: Hawaii Unemployment Among Persons with Disabilities
10.7%
(2012)
Compared to:
Prior Value
(5.2%)
Prior Value compares a measured value with the previously measured value. Confidence intervals were not taken into account in determining the direction of the comparison.
State: Hawaii
Health / Family Planning
Value
Compared to:
State: Hawaii Abstain From Sex- Teen Boys
State: Hawaii Abstain From Sex- Teen Boys
80.4%
(2021)
Compared to:
US Value
(70.7%)
The regional value is compared to the national value.
Prior Value
(74.2%)
Prior Value compares a measured value with the previously measured value. Confidence intervals were taken into account in determining the direction of the comparison.
Trend
This comparison measures the indicator’s values over multiple time periods.<br>The Mann-Kendall Test for Statistical Significance is used to evaluate the trend<br>over 4 to 10 periods of measure, subject to data availability and comparability.
State: Hawaii Abstain From Sex- Teen Girls
State: Hawaii Abstain From Sex- Teen Girls
80.0%
(2021)
Compared to:
US Value
(69.4%)
The regional value is compared to the national value.
Prior Value
(70.6%)
Prior Value compares a measured value with the previously measured value. Confidence intervals were taken into account in determining the direction of the comparison.
Trend
This comparison measures the indicator’s values over multiple time periods.<br>The Mann-Kendall Test for Statistical Significance is used to evaluate the trend<br>over 4 to 10 periods of measure, subject to data availability and comparability.
State: Hawaii Abstain From Sex- Young Teen Boys
State: Hawaii Abstain From Sex- Young Teen Boys
96.4%
(2021)
Compared to:
Prior Value
(91.5%)
Prior Value compares a measured value with the previously measured value. Confidence intervals were taken into account in determining the direction of the comparison.
Trend
This comparison measures the indicator’s values over multiple time periods.<br>The Mann-Kendall Test for Statistical Significance is used to evaluate the trend<br>over 4 to 10 periods of measure, subject to data availability and comparability.
State: Hawaii Abstain From Sex- Young Teen Girls
State: Hawaii Abstain From Sex- Young Teen Girls
95.1%
(2021)
Compared to:
Prior Value
(94.7%)
Prior Value compares a measured value with the previously measured value. Confidence intervals were taken into account in determining the direction of the comparison.
Trend
This comparison measures the indicator’s values over multiple time periods.<br>The Mann-Kendall Test for Statistical Significance is used to evaluate the trend<br>over 4 to 10 periods of measure, subject to data availability and comparability.
State: Hawaii Births to Mothers Under 18 Years
State: Hawaii Births to Mothers Under 18 Years
0.6%
% of births to mothers <18
(2021)
Compared to:
Prior Value
(0.7%)
Prior Value compares a measured value with the previously measured value. Confidence intervals were taken into account in determining the direction of the comparison.
Trend
This comparison measures the indicator’s values over multiple time periods.<br>The Mann-Kendall Test for Statistical Significance is used to evaluate the trend<br>over 4 to 10 periods of measure, subject to data availability and comparability.
State: Hawaii Infants Born to Mothers with <12 Yrs Education
State: Hawaii Infants Born to Mothers with <12 Yrs Education
15.8%
(2021)
Compared to:
US Value
(11.1%)
The regional value is compared to the national value.
Prior Value
(16.9%)
Prior Value compares a measured value with the previously measured value. Confidence intervals were taken into account in determining the direction of the comparison.
Trend
This comparison measures the indicator’s values over multiple time periods.<br>The Mann-Kendall Test for Statistical Significance is used to evaluate the trend<br>over 4 to 10 periods of measure, subject to data availability and comparability.
State: Hawaii Pregnancies Among Females Aged 15-19 Years
State: Hawaii Pregnancies Among Females Aged 15-19 Years
17.4
Pregnancies per 1,000 females aged 15-19
(2021)
Compared to:
US Value
(31.0 in 2017)
The regional value is compared to the national value.
Prior Value
(17.6)
Prior Value compares a measured value with the previously measured value. Confidence intervals were not taken into account in determining the direction of the comparison.
Trend
This comparison measures the indicator’s values over multiple time periods.<br>The Mann-Kendall Test for Statistical Significance is used to evaluate the trend<br>over 4 to 10 periods of measure, subject to data availability and comparability.
HP 2030 Target
(31.4)
<div><span>FP-03: Reduce pregnancies in adolescents<br /> <br />The national indicator definition and data source are the same as for the state.</span></div>
