
Advanced Search: Build a Custom Dashboard
In the fields below, search for indicators by location, topics, population, classification, subgroup, or comparison. No fields are required, but we suggest selecting a location or two to start. In the additional search options section, select options to group and order search results. To learn more about how to customize a dashboard, see our help center.
Visit the Indicator List Page to see the full list of indicators and locations available on the site.
Search Results:
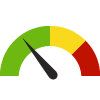
Indicator Gauge Icon Legend
Legend Colors
Red is bad, green is good, blue is not statistically different/neutral.
Compared to Distribution
 the value is in the best half of communities.
 the value is in the 2nd worst quarter of communities.
 the value is in the worst quarter of communities.
Compared to Target
 meets target;
  does not meet target.
Compared to a Single Value
 lower than the comparison value;
 higher than the comparison value;
 not statistically different from comparison value.
Trend

 non-significant change over time;
 significant change over time;
  no change over time.
Compared to Prior Value
 higher than the previous measurement period;
 lower than the previous measurement period;
 no statistically different change from previous measurement period.
Health / Wellness & Lifestyle
Health / Wellness & Lifestyle
County: Hawaii
Value
Compared to:
County: Hawaii Adult Poor Physical Health: 14+ Days
County: Hawaii Adult Poor Physical Health: 14+ Days
12.2%
(2022)
Compared to:

HI Value
(9.5%)
The regional value is compared to the Hawaii State value.
Median Value for States and Territories
(12.4%)
The regional value is compared to the median value for states and territories.
Prior Value
(9.8%)
Prior Value compares a measured value with the previously measured value. Confidence intervals were taken into account in determining the direction of the comparison.
Trend
This comparison measures the indicator’s values over multiple time periods.<br>The Mann-Kendall Test for Statistical Significance is used to evaluate the trend<br>over 4 to 10 periods of measure, subject to data availability and comparability.
County: Hawaii Adults Aware of the Hawaii Tobacco Quitline
County: Hawaii Adults Aware of the Hawaii Tobacco Quitline
72.7
(2022)
Compared to:
HI Value
(71.3)
The regional value is compared to the Hawaii State value.
Prior Value
(71.3)
Prior Value compares a measured value with the previously measured value. Confidence intervals were taken into account in determining the direction of the comparison.
Trend
This comparison measures the indicator’s values over multiple time periods.<br>The Mann-Kendall Test for Statistical Significance is used to evaluate the trend<br>over 4 to 10 periods of measure, subject to data availability and comparability.
TPC Plan Target
(81)
County: Hawaii Adults Happy with Weight
County: Hawaii Adults Happy with Weight
49.8%
(2023)
Compared to:


HI Value
(51.4%)
The regional value is compared to the Hawaii State value.
US Value
(48.7%)
The regional value is compared to the national value.
Prior Value
(52.4%)
Prior Value compares a measured value with the previously measured value. Confidence intervals were not taken into account in determining the direction of the comparison.
County: Hawaii Adults who Agree Vaccine Benefits Outweigh Possible Risks
County: Hawaii Adults who Agree Vaccine Benefits Outweigh Possible Risks
72.0%
(2023)
Compared to:

U.S. Counties
The distribution is based on data from 3,141 U.S. counties and county equivalents.
HI Value
(75.5%)
The regional value is compared to the Hawaii State value.
US Value
(70.1%)
The regional value is compared to the national value.
Prior Value
(78.9%)
Prior Value compares a measured value with the previously measured value. Confidence intervals were not taken into account in determining the direction of the comparison.
County: Hawaii Adults Who Belong to a Fitness Club or Gym
County: Hawaii Adults Who Belong to a Fitness Club or Gym
13.3%
(2023)
Compared to:

HI Value
(18.8%)
The regional value is compared to the Hawaii State value.
US Value
(16.0%)
The regional value is compared to the national value.
Prior Value
(13.3%)
Prior Value compares a measured value with the previously measured value. Confidence intervals were not taken into account in determining the direction of the comparison.
County: Hawaii Adults Who Binge Drink
County: Hawaii Adults Who Binge Drink
18.3%
(2022)
Compared to:
HI Value
(18.2%)
The regional value is compared to the Hawaii State value.
Median Value for States and Territories
(16.9%)
The regional value is compared to the median value for states and territories.
Prior Value
(19.4%)
Prior Value compares a measured value with the previously measured value. Confidence intervals were taken into account in determining the direction of the comparison.
Trend
This comparison measures the indicator’s values over multiple time periods.<br>The Mann-Kendall Test for Statistical Significance is used to evaluate the trend<br>over 4 to 10 periods of measure, subject to data availability and comparability.
HP 2030 LHI
(25.4%)
<div>SU-10: Reduce the proportion of people aged 21 years and over who engaged in binge drinking in the past month <strong>(LEADING HEALTH INDICATOR)</strong><br /> <br />The national indicator includes persons aged 21 and over. The data source for the national indicator is the National Survey on Drug Use and Health. The state data source is the Behavioral Risk Factor Surveillance System, which is comparable to the national source but includes adults 18 years and older.</div>
County: Hawaii Adults Who Drink Excessively
County: Hawaii Adults Who Drink Excessively
20.1%
(2022)
Compared to:
HI Value
(19.9%)
The regional value is compared to the Hawaii State value.
Prior Value
(20.7%)
Prior Value compares a measured value with the previously measured value. Confidence intervals were taken into account in determining the direction of the comparison.
Trend
This comparison measures the indicator’s values over multiple time periods.<br>The Mann-Kendall Test for Statistical Significance is used to evaluate the trend<br>over 4 to 10 periods of measure, subject to data availability and comparability.
County: Hawaii Adults who Ever Used an Electronic Smoking Device
County: Hawaii Adults who Ever Used an Electronic Smoking Device
33.7%
(2022)
Compared to:


HI Value
(34.0%)
The regional value is compared to the Hawaii State value.
Median Value for States and Territories
(28.0%)
The regional value is compared to the median value for states and territories.
Prior Value
(26.2%)
Prior Value compares a measured value with the previously measured value. Confidence intervals were taken into account in determining the direction of the comparison.
Trend
This comparison measures the indicator’s values over multiple time periods.<br>The Mann-Kendall Test for Statistical Significance is used to evaluate the trend<br>over 4 to 10 periods of measure, subject to data availability and comparability.
County: Hawaii Adults who Feel Life is Slipping Out of Control
County: Hawaii Adults who Feel Life is Slipping Out of Control
24.4%
(2023)
Compared to:
HI Value
(24.7%)
The regional value is compared to the Hawaii State value.
US Value
(26.7%)
The regional value is compared to the national value.
Prior Value
(28.4%)
Prior Value compares a measured value with the previously measured value. Confidence intervals were not taken into account in determining the direction of the comparison.
County: Hawaii Adults who Follow a Regular Exercise Routine
County: Hawaii Adults who Follow a Regular Exercise Routine
69.1%
(2023)
Compared to:
HI Value
(71.7%)
The regional value is compared to the Hawaii State value.
US Value
(67.2%)
The regional value is compared to the national value.
Prior Value
(56.5%)
Prior Value compares a measured value with the previously measured value. Confidence intervals were not taken into account in determining the direction of the comparison.
County: Hawaii Adults Who Formerly Smoked Cigarettes
County: Hawaii Adults Who Formerly Smoked Cigarettes
30.3%
(2022)
Compared to:
HI Value
(25.7%)
The regional value is compared to the Hawaii State value.
Median Value for States and Territories
(24.9% in 2021)
The regional value is compared to the median value for states and territories.
Prior Value
(30.2%)
Prior Value compares a measured value with the previously measured value. Confidence intervals were taken into account in determining the direction of the comparison.
Trend
This comparison measures the indicator’s values over multiple time periods.<br>The Mann-Kendall Test for Statistical Significance is used to evaluate the trend<br>over 4 to 10 periods of measure, subject to data availability and comparability.
TPC Plan Target
(28.2%)
County: Hawaii Adults who Frequently Cook Meals at Home
County: Hawaii Adults who Frequently Cook Meals at Home
80.4%
(2023)
Compared to:
HI Value
(80.0%)
The regional value is compared to the Hawaii State value.
US Value
(78.0%)
The regional value is compared to the national value.
Prior Value
(73.4%)
Prior Value compares a measured value with the previously measured value. Confidence intervals were not taken into account in determining the direction of the comparison.
33.9%
(2023)
Compared to:

U.S. Counties
The distribution is based on data from 3,141 U.S. counties and county equivalents.
HI Value
(38.3%)
The regional value is compared to the Hawaii State value.
US Value
(40.4%)
The regional value is compared to the national value.
Prior Value
(35.3%)
Prior Value compares a measured value with the previously measured value. Confidence intervals were not taken into account in determining the direction of the comparison.
Trend
This comparison measures the indicator’s values over multiple time periods.<br>The Mann-Kendall Test for Statistical Significance is used to evaluate the trend<br>over 4 to 10 periods of measure, subject to data availability and comparability.
County: Hawaii Adults Who Get Insufficient Sleep
County: Hawaii Adults Who Get Insufficient Sleep
40.1%
(2022)
Compared to:
HI Value
(45.6%)
The regional value is compared to the Hawaii State value.
Prior Value
(38.8%)
Prior Value compares a measured value with the previously measured value. Confidence intervals were taken into account in determining the direction of the comparison.
Trend
This comparison measures the indicator’s values over multiple time periods.<br>The Mann-Kendall Test for Statistical Significance is used to evaluate the trend<br>over 4 to 10 periods of measure, subject to data availability and comparability.
HP 2030 Target
(31.4%)
<div>SH-03: Increase the proportion of adults who get enough sleep</div>
<div> </div>
<div>The national indicator is defined as adults who get an average of at least 7 hours of sleep. <span style="font-weight:400;">The data source for the national indicator is the National Health Interview Survey, from which state-level data for Hawaiʻi cannot be obtained. The state data source is the Behavioral Risk Factor Surveillance System, which is comparable to the national data source, but is the inverse, people who get fewer than 7 hours of sleep on average. The HP 2030 target has been adjusted accordingly.</span></div>
<div> </div>
25.5%
(2019)
Compared to:

HI Value
(24.8%)
The regional value is compared to the Hawaii State value.
Median Value for States and Territories
(23.0%)
The regional value is compared to the median value for states and territories.
Prior Value
(22.0%)
Prior Value compares a measured value with the previously measured value. Confidence intervals were taken into account in determining the direction of the comparison.
Trend
This comparison measures the indicator’s values over multiple time periods.<br>The Mann-Kendall Test for Statistical Significance is used to evaluate the trend<br>over 4 to 10 periods of measure, subject to data availability and comparability.
HP 2030 LHI
(29.7%)
<div><span>PA-05: Increase the proportion of adults who do enough aerobic and muscle-strengthening activity <strong>(LEADING HEALTH INDICATOR)</strong><br /> <br />The national indicator is defined in exactly the same way. The data source for the national indicator is the National Health Interview Survey, from which state-level data for Hawaiʻi cannot be obtained. The state data source is the Behavioral Risk Factor Surveillance System, which is comparable to the national data source.</span></div>
PAN Plan Target
(29.7%)
County: Hawaii Adults Who Meet Aerobic Physical Activity Guidelines
County: Hawaii Adults Who Meet Aerobic Physical Activity Guidelines
57.4%
(2019)
Compared to:
HI Value
(56.0%)
The regional value is compared to the Hawaii State value.
Median Value for States and Territories
(49.9%)
The regional value is compared to the median value for states and territories.
Prior Value
(57.0%)
Prior Value compares a measured value with the previously measured value. Confidence intervals were taken into account in determining the direction of the comparison.
Trend
This comparison measures the indicator’s values over multiple time periods.<br>The Mann-Kendall Test for Statistical Significance is used to evaluate the trend<br>over 4 to 10 periods of measure, subject to data availability and comparability.
HP 2030 Target
(52.9%)
<div><span>PA-02: Increase the proportion of adults who do enough aerobic physical activity for substantial health benefits<br /><br />The national indicator is defined in exactly the same way. The data source for the national indicator is the National Health Interview Survey, from which state-level data for Hawaii cannot be obtained. The state data source is the Behavioral Risk Factor Surveillance System, which is comparable to the national data source.</span></div>
PAN Plan Target
(62.2%)
County: Hawaii Adults Who Meet High Aerobic Physical Activity Guidelines
County: Hawaii Adults Who Meet High Aerobic Physical Activity Guidelines
42.3%
(2019)
Compared to:
HI Value
(36.3%)
The regional value is compared to the Hawaii State value.
Median Value for States and Territories
(32.1%)
The regional value is compared to the median value for states and territories.
Prior Value
(40.7%)
Prior Value compares a measured value with the previously measured value. Confidence intervals were taken into account in determining the direction of the comparison.
Trend
This comparison measures the indicator’s values over multiple time periods.<br>The Mann-Kendall Test for Statistical Significance is used to evaluate the trend<br>over 4 to 10 periods of measure, subject to data availability and comparability.
HP 2030 Target
(33.9%)
<div><span>PA-03: Increase the proportion of adults who do enough aerobic physical activity for extensive health benefits<br /> <br />The national indicator is defined in exactly the same way. The data source for the national indicator is the National Health Interview Survey, from which state-level data for Hawaii cannot be obtained. The state data source is the Behavioral Risk Factor Surveillance System, which is comparable to the national data source.</span></div>
PAN Plan Target
(40.3%)
County: Hawaii Adults Who Meet Muscle Strengthening Guidelines
County: Hawaii Adults Who Meet Muscle Strengthening Guidelines
37.0%
(2019)
Compared to:
HI Value
(37.9%)
The regional value is compared to the Hawaii State value.
Median Value for States and Territories
(35.7%)
The regional value is compared to the median value for states and territories.
Prior Value
(30.9%)
Prior Value compares a measured value with the previously measured value. Confidence intervals were taken into account in determining the direction of the comparison.
Trend
This comparison measures the indicator’s values over multiple time periods.<br>The Mann-Kendall Test for Statistical Significance is used to evaluate the trend<br>over 4 to 10 periods of measure, subject to data availability and comparability.
HP 2030 Target
(36.6%)
<div><span>PA-04: Increase the proportion of adults who do enough muscle-strengthening activity<br /> <br />The national indicator is defined in exactly the same way. The data source for the national indicator is the National Health Interview Survey, from which state-level data for Hawaii cannot be obtained. The state data source is the Behavioral Risk Factor Surveillance System, which is comparable to the national data source.</span></div>
PAN Plan Target
(42.1%)
County: Hawaii Adults Who Smoke Cigarettes
County: Hawaii Adults Who Smoke Cigarettes
13.2%
(2022)
Compared to:
HI Value
(10.0%)
The regional value is compared to the Hawaii State value.
Median Value for States and Territories
(13.5%)
The regional value is compared to the median value for states and territories.
Prior Value
(12.0%)
Prior Value compares a measured value with the previously measured value. Confidence intervals were taken into account in determining the direction of the comparison.
Trend
This comparison measures the indicator’s values over multiple time periods.<br>The Mann-Kendall Test for Statistical Significance is used to evaluate the trend<br>over 4 to 10 periods of measure, subject to data availability and comparability.
HP 2030 LHI
(6.1%)
<div>TU-02: Reduce current cigarette smoking in adults <strong>(LEADING HEALTH INDICATOR)</strong><br /> <br />The national indicator is defined in exactly the same way. The data source for the national indicator is the National Health Interview Survey, from which state-level data for Hawaii cannot be obtained. The state data source is the Behavioral Risk Factor Surveillance System, which is comparable to the national source.</div>
TPC Plan Target
(6.1%)
County: Hawaii Adults Who Use an Electronic Smoking Device
County: Hawaii Adults Who Use an Electronic Smoking Device
7.8%
(2022)
Compared to:

HI Value
(8.8%)
The regional value is compared to the Hawaii State value.
Median Value for States and Territories
(7.6%)
The regional value is compared to the median value for states and territories.
Prior Value
(7.1%)
Prior Value compares a measured value with the previously measured value. Confidence intervals were taken into account in determining the direction of the comparison.
Trend
This comparison measures the indicator’s values over multiple time periods.<br>The Mann-Kendall Test for Statistical Significance is used to evaluate the trend<br>over 4 to 10 periods of measure, subject to data availability and comparability.
TPC Plan Target
(2.3%)
County: Hawaii Adults Who've Had Skin Cancer
County: Hawaii Adults Who've Had Skin Cancer
7.0%
(2021)
Compared to:
HI Value
(4.8%)
The regional value is compared to the Hawaii State value.
Median Value for States and Territories
(6.6%)
The regional value is compared to the median value for states and territories.
Prior Value
(6.5%)
Prior Value compares a measured value with the previously measured value. Confidence intervals were taken into account in determining the direction of the comparison.
Trend
This comparison measures the indicator’s values over multiple time periods.<br>The Mann-Kendall Test for Statistical Significance is used to evaluate the trend<br>over 4 to 10 periods of measure, subject to data availability and comparability.
Cancer Plan Target
(4.1%)
County: Hawaii Adults with Good Physical and Mental Health
County: Hawaii Adults with Good Physical and Mental Health
48.8%
(2022)
Compared to:
HI Value
(50.3%)
The regional value is compared to the Hawaii State value.
Median Value for States and Territories
(49.6% in 2011)
The regional value is compared to the median value for states and territories.
Prior Value
(51.4%)
Prior Value compares a measured value with the previously measured value. Confidence intervals were taken into account in determining the direction of the comparison.
Trend
This comparison measures the indicator’s values over multiple time periods.<br>The Mann-Kendall Test for Statistical Significance is used to evaluate the trend<br>over 4 to 10 periods of measure, subject to data availability and comparability.
County: Hawaii Adults with Health Status of Good or Better
County: Hawaii Adults with Health Status of Good or Better
84.0%
(2022)
Compared to:
HI Value
(86.0%)
The regional value is compared to the Hawaii State value.
Median Value for States and Territories
(83.0%)
The regional value is compared to the median value for states and territories.
Prior Value
(85.9%)
Prior Value compares a measured value with the previously measured value. Confidence intervals were taken into account in determining the direction of the comparison.
Trend
This comparison measures the indicator’s values over multiple time periods.<br>The Mann-Kendall Test for Statistical Significance is used to evaluate the trend<br>over 4 to 10 periods of measure, subject to data availability and comparability.
PAN Plan Target
(97.7%)
County: Hawaii Adults with High Blood Pressure
County: Hawaii Adults with High Blood Pressure
33.5%
(2021)
Compared to:
HI Value
(29.8%)
The regional value is compared to the Hawaii State value.
Median Value for States and Territories
(11.1%)
The regional value is compared to the median value for states and territories.
Prior Value
(31.8%)
Prior Value compares a measured value with the previously measured value. Confidence intervals were taken into account in determining the direction of the comparison.
Trend
This comparison measures the indicator’s values over multiple time periods.<br>The Mann-Kendall Test for Statistical Significance is used to evaluate the trend<br>over 4 to 10 periods of measure, subject to data availability and comparability.
HP 2030 Target
(42.6%)
<div>HDS-04: Reduce the proportion of adults with high blood pressure<br /> <br />The national indicator excludes pregnant women. The data source for the national indicator is the National Health and Nutrition Examination Survey, which is not conducted in Hawaii. The state data source is the Behavioral Risk Factor Surveillance System, which is self-reported but comparable to the national data source.</div>
County: Hawaii Adults with Medical Conditions Limiting Lifestyle
County: Hawaii Adults with Medical Conditions Limiting Lifestyle
37.4%
(2023)
Compared to:


HI Value
(33.2%)
The regional value is compared to the Hawaii State value.
US Value
(33.6%)
The regional value is compared to the national value.
Prior Value
(39.8%)
Prior Value compares a measured value with the previously measured value. Confidence intervals were not taken into account in determining the direction of the comparison.
County: Hawaii Doctor Advised About Weight Among Obese/Overweight
County: Hawaii Doctor Advised About Weight Among Obese/Overweight
37.1%
(2018)
Compared to:
HI Value
(42.8%)
The regional value is compared to the Hawaii State value.
Prior Value
(33.0%)
Prior Value compares a measured value with the previously measured value. Confidence intervals were taken into account in determining the direction of the comparison.
PAN Plan Target
(41.0%)
County: Hawaii Life Expectancy
County: Hawaii Life Expectancy
80.2
Years
(2019-2021)
Compared to:
U.S. Counties
The distribution is based on data from 3,070 U.S. counties and county equivalents.
HI Value
(81.8)
The regional value is compared to the Hawaii State value.
US Value
(77.6)
The regional value is compared to the national value.
County: Hawaii Self-Reported General Health Assessment: Good or Better
County: Hawaii Self-Reported General Health Assessment: Good or Better
85.6%
(2023)
Compared to:
U.S. Counties
The distribution is based on data from 3,141 U.S. counties and county equivalents.
HI Value
(87.7%)
The regional value is compared to the Hawaii State value.
US Value
(85.4%)
The regional value is compared to the national value.
Prior Value
(85.5%)
Prior Value compares a measured value with the previously measured value. Confidence intervals were not taken into account in determining the direction of the comparison.
Trend
This comparison measures the indicator’s values over multiple time periods.<br>The Mann-Kendall Test for Statistical Significance is used to evaluate the trend<br>over 4 to 10 periods of measure, subject to data availability and comparability.
PAN Plan Target
(97.7%)
County: Hawaii Self-Reported General Health Assessment: Poor or Fair
County: Hawaii Self-Reported General Health Assessment: Poor or Fair
16.0%
(2021)
Compared to:
U.S. Counties
The distribution is based on data from 3,074 U.S. counties and county equivalents.
US Value
(16.1%)
The regional value is compared to the national value.
County: Hawaii Sexual Minority Adults
County: Hawaii Sexual Minority Adults
5.8%
(2022)
Compared to:

HI Value
(6.1%)
The regional value is compared to the Hawaii State value.
Prior Value
(5.7%)
Prior Value compares a measured value with the previously measured value. Confidence intervals were taken into account in determining the direction of the comparison.
Trend
This comparison measures the indicator’s values over multiple time periods.<br>The Mann-Kendall Test for Statistical Significance is used to evaluate the trend<br>over 4 to 10 periods of measure, subject to data availability and comparability.
County: Hawaii Sexual or Gender Minority Adults
County: Hawaii Sexual or Gender Minority Adults
6.2%
(2022)
Compared to:
HI Value
(6.4%)
The regional value is compared to the Hawaii State value.
Prior Value
(6.5%)
Prior Value compares a measured value with the previously measured value. Confidence intervals were taken into account in determining the direction of the comparison.
Trend
This comparison measures the indicator’s values over multiple time periods.<br>The Mann-Kendall Test for Statistical Significance is used to evaluate the trend<br>over 4 to 10 periods of measure, subject to data availability and comparability.
County: Hawaii Teens Who Get Sufficient Sleep
County: Hawaii Teens Who Get Sufficient Sleep
26.5%
(2021)
Compared to:

HI Value
(23.5%)
The regional value is compared to the Hawaii State value.
US Value
(22.7%)
The regional value is compared to the national value.
Prior Value
(25.7%)
Prior Value compares a measured value with the previously measured value. Confidence intervals were taken into account in determining the direction of the comparison.
Trend
This comparison measures the indicator’s values over multiple time periods.<br>The Mann-Kendall Test for Statistical Significance is used to evaluate the trend<br>over 4 to 10 periods of measure, subject to data availability and comparability.
HP 2030 Target
(27.4%)
<div>
<div><span class="bold"><span>SH-04: </span></span><span>Increase the proportion of high school students in grades who get enough sleep</span></div>
<div> </div>
<div><span>The national indicator definition and data source are the same as for the state.</span></div>
</div>
County: Hawaii Teens with 2 Hours or Less of Computer and Video Game Time
County: Hawaii Teens with 2 Hours or Less of Computer and Video Game Time
63.8%
(2019)
Compared to:
HI Value
(58.2%)
The regional value is compared to the Hawaii State value.
US Value
(53.9%)
The regional value is compared to the national value.
Prior Value
(61.3%)
Prior Value compares a measured value with the previously measured value. Confidence intervals were taken into account in determining the direction of the comparison.
Trend
This comparison measures the indicator’s values over multiple time periods.<br>The Mann-Kendall Test for Statistical Significance is used to evaluate the trend<br>over 4 to 10 periods of measure, subject to data availability and comparability.
PAN Plan Target
(82.6%)
County: Hawaii Teens with 2 Hours or Less of TV Time
County: Hawaii Teens with 2 Hours or Less of TV Time
80.6%
(2019)
Compared to:
HI Value
(82.9%)
The regional value is compared to the Hawaii State value.
US Value
(80.2%)
The regional value is compared to the national value.
Prior Value
(81.8%)
Prior Value compares a measured value with the previously measured value. Confidence intervals were taken into account in determining the direction of the comparison.
Trend
This comparison measures the indicator’s values over multiple time periods.<br>The Mann-Kendall Test for Statistical Significance is used to evaluate the trend<br>over 4 to 10 periods of measure, subject to data availability and comparability.
PAN Plan Target
(73.9%)
County: Hawaii Young Teens Who Get Sufficient Sleep
County: Hawaii Young Teens Who Get Sufficient Sleep
45.2%
(2021)
Compared to:
HI Value
(46.1%)
The regional value is compared to the Hawaii State value.
Prior Value
(47.2%)
Prior Value compares a measured value with the previously measured value. Confidence intervals were taken into account in determining the direction of the comparison.
Trend
This comparison measures the indicator’s values over multiple time periods.<br>The Mann-Kendall Test for Statistical Significance is used to evaluate the trend<br>over 4 to 10 periods of measure, subject to data availability and comparability.
HP 2030 Target
(27.4%)
<div>
<div><span class="bold"><span>SH-04: </span></span><span>Increase the proportion of students in grades 9 through 12 who get sufficient sleep</span></div>
<div> </div>
<div><span>The national indicator definition and data source are the same as for the state. There is no national middle school survey for students in grades 6-8; however, Hawaiʻi has additional data for this indicator. </span></div>
</div>
54.0%
(2019)
Compared to:
HI Value
(51.3%)
The regional value is compared to the Hawaii State value.
Prior Value
(57.0%)
Prior Value compares a measured value with the previously measured value. Confidence intervals were taken into account in determining the direction of the comparison.
Trend
This comparison measures the indicator’s values over multiple time periods.<br>The Mann-Kendall Test for Statistical Significance is used to evaluate the trend<br>over 4 to 10 periods of measure, subject to data availability and comparability.
PAN Plan Target
(100%)
County: Hawaii Young Teens with 2 Hours or Less of TV Time
County: Hawaii Young Teens with 2 Hours or Less of TV Time
74.9%
(2019)
Compared to:
HI Value
(76.2%)
The regional value is compared to the Hawaii State value.
Prior Value
(75.4%)
Prior Value compares a measured value with the previously measured value. Confidence intervals were taken into account in determining the direction of the comparison.
Trend
This comparison measures the indicator’s values over multiple time periods.<br>The Mann-Kendall Test for Statistical Significance is used to evaluate the trend<br>over 4 to 10 periods of measure, subject to data availability and comparability.
PAN Plan Target
(86.8%)
