
Search for Indicators
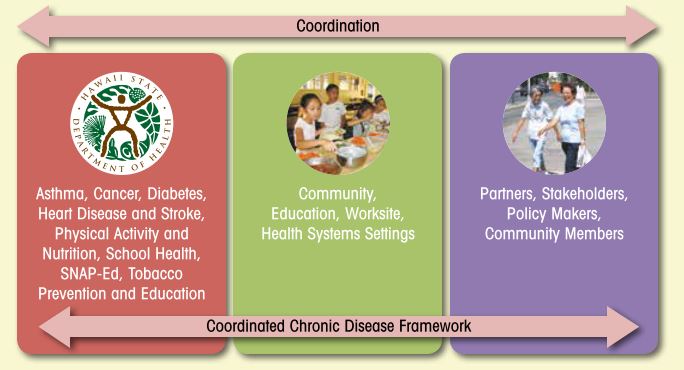
Coordinated Chronic Disease Framework
The 2014-2020 Hawaii Coordinated Chronic Disease Framework is a plan for preventing and reducing the burden of chronic disease in the state that was developed by the Hawaii State Department of Health, Chronic Disease Prevention and Health Promotion Division. This division is composed of the following programs:
- Asthma Control
- Comprehensive Cancer Control
- Breast and Cervical Cancer Control
- Diabetes Prevention and Control
- Heart Disease and Stroke Prevention
- Physical Activity and Nutrition
- School Health
- SNAP-Ed (Supplemental Nutrition Assistance Program Education)
- Tobacco Prevention and Education
The framework for coordination identifies overarching priorities for health promotion and disease prevention in Hawaii. It is not an action plan, but rather a guide for coordinating multiple programs with the goal of focusing resources and working on common areas of chronic disease prevention and control.
This framework has been updated and expanded in the NEW Healthy Hawai′i Strategic Plan 2030. Click here to see the new Long Term Measures.
***This tracker will be retired soon.***
Indicator Gauge Icon Legend
Legend Colors
Red is bad, green is good, blue is not statistically different/neutral.
Compared to Distribution
 the value is in the best half of communities.
 the value is in the 2nd worst quarter of communities.
 the value is in the worst quarter of communities.
Compared to Target
 meets target;
  does not meet target.
Compared to a Single Value
 lower than the comparison value;
 higher than the comparison value;
 not statistically different from comparison value.
Trend

 non-significant change over time;
 significant change over time;
  no change over time.
Compared to Prior Value
 higher than the previous measurement period;
 lower than the previous measurement period;
 no statistically different change from previous measurement period.
Nutrition and Weight Status
Nutrition and Weight Status
State: Hawaii
Value
Compared to:
State: Hawaii Adult Fruit and Vegetable Consumption
State: Hawaii Adult Fruit and Vegetable Consumption
14.6%
(2021)
Compared to:


Prior Value
(17.5%)
Prior Value compares a measured value with the previously measured value. Confidence intervals were taken into account in determining the direction of the comparison.
Trend
This comparison measures the indicator’s values over multiple time periods.<br>The Mann-Kendall Test for Statistical Significance is used to evaluate the trend<br>over 4 to 10 periods of measure, subject to data availability and comparability.
PAN Plan Target
(19.4%)
State: Hawaii Teen Fruit and Vegetable Consumption
State: Hawaii Teen Fruit and Vegetable Consumption
13.8%
(2021)
Compared to:


US Value
(22.3% in 2011)
This distribution is based on the national average from YRBS, which is a national school-based survey of public schools.
Prior Value
(13.9%)
Prior Value compares a measured value with the previously measured value. Confidence intervals were taken into account in determining the direction of the comparison.
Trend
This comparison measures the indicator’s values over multiple time periods.<br>The Mann-Kendall Test for Statistical Significance is used to evaluate the trend<br>over 4 to 10 periods of measure, subject to data availability and comparability.
PAN Plan Target
(15.4%)
State: Hawaii Teens who are Obese
State: Hawaii Teens who are Obese
14.9%
(2021)
Compared to:

US Value
(16.3%)
The regional value is compared to the national value.
Prior Value
(16.4%)
Prior Value compares a measured value with the previously measured value. Confidence intervals were taken into account in determining the direction of the comparison.
Trend
This comparison measures the indicator’s values over multiple time periods.<br>The Mann-Kendall Test for Statistical Significance is used to evaluate the trend<br>over 4 to 10 periods of measure, subject to data availability and comparability.
Physical Activity
Physical Activity
State: Hawaii
Value
Compared to:
State: Hawaii Adults Who Meet Aerobic Physical Activity Guidelines
State: Hawaii Adults Who Meet Aerobic Physical Activity Guidelines
56.0%
(2019)
Compared to:
Median Value for States and Territories
(49.9%)
The regional value is compared to the median value for states and territories.
Prior Value
(56.5%)
Prior Value compares a measured value with the previously measured value. Confidence intervals were taken into account in determining the direction of the comparison.
Trend
This comparison measures the indicator’s values over multiple time periods.<br>The Mann-Kendall Test for Statistical Significance is used to evaluate the trend<br>over 4 to 10 periods of measure, subject to data availability and comparability.
HP 2030 Target
(52.9%)
<div><span>PA-02: Increase the proportion of adults who do enough aerobic physical activity for substantial health benefits<br /><br />The national indicator is defined in exactly the same way. The data source for the national indicator is the National Health Interview Survey, from which state-level data for Hawaii cannot be obtained. The state data source is the Behavioral Risk Factor Surveillance System, which is comparable to the national data source.</span></div>
PAN Plan Target
(62.2%)
24.8%
(2019)
Compared to:
Median Value for States and Territories
(23.0%)
The regional value is compared to the median value for states and territories.
Prior Value
(24.6%)
Prior Value compares a measured value with the previously measured value. Confidence intervals were taken into account in determining the direction of the comparison.
Trend
This comparison measures the indicator’s values over multiple time periods.<br>The Mann-Kendall Test for Statistical Significance is used to evaluate the trend<br>over 4 to 10 periods of measure, subject to data availability and comparability.
HP 2030 LHI
(29.7%)
<div><span>PA-05: Increase the proportion of adults who do enough aerobic and muscle-strengthening activity <strong>(LEADING HEALTH INDICATOR)</strong><br /> <br />The national indicator is defined in exactly the same way. The data source for the national indicator is the National Health Interview Survey, from which state-level data for Hawaiʻi cannot be obtained. The state data source is the Behavioral Risk Factor Surveillance System, which is comparable to the national data source.</span></div>
PAN Plan Target
(29.7%)
17.7%
(2021)
Compared to:
Prior Value
(13.4%)
Prior Value compares a measured value with the previously measured value. Confidence intervals were taken into account in determining the direction of the comparison.
Trend
This comparison measures the indicator’s values over multiple time periods.<br>The Mann-Kendall Test for Statistical Significance is used to evaluate the trend<br>over 4 to 10 periods of measure, subject to data availability and comparability.
HP 2030 Target
(24.1%)
<div>PA-08: Increase the proportion of adolescents who do enough aerobic and muscle-strengthening activity</div>
<div> </div>
<div>The national indicator is defined exactly the same way. </div>
19.0%
(2021)
Compared to:
Prior Value
(16.9%)
Prior Value compares a measured value with the previously measured value. Confidence intervals were taken into account in determining the direction of the comparison.
Trend
This comparison measures the indicator’s values over multiple time periods.<br>The Mann-Kendall Test for Statistical Significance is used to evaluate the trend<br>over 4 to 10 periods of measure, subject to data availability and comparability.
Maternal, Infant and Child Health
Maternal, Infant and Child Health
State: Hawaii
Value
Compared to:
State: Hawaii Infants Who Were Breastfed Exclusively Through 6 Months
State: Hawaii Infants Who Were Breastfed Exclusively Through 6 Months
26.6%
(2020)
Compared to:
US Value
(25.4%)
The regional value is compared to the national value.
Prior Value
(27.7%)
Prior Value compares a measured value with the previously measured value. Confidence intervals were taken into account in determining the direction of the comparison.
Trend
This comparison measures the indicator’s values over multiple time periods.<br>The Mann-Kendall Test for Statistical Significance is used to evaluate the trend<br>over 4 to 10 periods of measure, subject to data availability and comparability.
HP 2030 Target
(42.4%)
<div>
<div>
<div>MICH-15: Increase the proportion of infants who are breastfed exclusively through age 6 months</div>
</div>
<div> </div>
<div>
<div>The national indicator definition and data source are the same as for the state.</div>
</div>
</div>
PAN Plan Target
(42.4%)
Tobacco Use
Tobacco Use
State: Hawaii
Value
Compared to:
State: Hawaii Teens Who Smoke Cigarettes
State: Hawaii Teens Who Smoke Cigarettes
3.0%
(2021)
Compared to:
US Value
(3.8%)
The regional value is compared to the national value.
Prior Value
(5.3%)
Prior Value compares a measured value with the previously measured value. Confidence intervals were taken into account in determining the direction of the comparison.
Trend
This comparison measures the indicator’s values over multiple time periods.<br>The Mann-Kendall Test for Statistical Significance is used to evaluate the trend<br>over 4 to 10 periods of measure, subject to data availability and comparability.
HP 2030 Target
(3.4%)
<div><span>TU-06: Reduce current cigarette smoking in adolescents<br /><br />The national indicator is defined in exactly the same way. The data source for the national indicator is the National Youth Tobacco Survey. The state data source is the Youth Risk Behavior Survey, which is comparable to the national data source. It is divided into two groups: grades 6-8 and grades 9-12. This indicator reports data for students in grades 9-12, while the indicator ‘Young Teens Who Smoke Cigarettes' reports for those in grades 6-8. </span></div>
TPC Plan Target
(3.4%)
State: Hawaii Young Teens Who Smoke Cigarettes
State: Hawaii Young Teens Who Smoke Cigarettes
1.9%
(2021)
Compared to:
Prior Value
(3.9%)
Prior Value compares a measured value with the previously measured value. Confidence intervals were taken into account in determining the direction of the comparison.
Trend
This comparison measures the indicator’s values over multiple time periods.<br>The Mann-Kendall Test for Statistical Significance is used to evaluate the trend<br>over 4 to 10 periods of measure, subject to data availability and comparability.
HP 2030 Target
(3.4%)
<div><span>TU-06: Reduce current cigarette smoking in adolescents<br /><br />The national indicator is defined in exactly the same way. The data source for the national indicator is the National Youth Tobacco Survey. The state data source is the Youth Risk Behavior Survey, which is comparable to the national data source. It is divided into two groups: grades 6-8 and grades 9-12. This indicator reports data for students in grades 6-8, while the indicator ‘Teens Who Smoke Cigarettes' reports for those in grades 9-12. </span></div>
TPC Plan Target
(3.4%)
State: Hawaii Adults Exposed to Secondhand Smoke
State: Hawaii Adults Exposed to Secondhand Smoke
8.4%
(2022)
Compared to:
Prior Value
(7.9%)
Prior Value compares a measured value with the previously measured value. Confidence intervals were taken into account in determining the direction of the comparison.
Trend
This comparison measures the indicator’s values over multiple time periods.<br>The Mann-Kendall Test for Statistical Significance is used to evaluate the trend<br>over 4 to 10 periods of measure, subject to data availability and comparability.
HP 2030 Target
(17.3%)
<div>TU-19: Reduce the proportion of people who donʻt smoke but are exposed to secondhand smoke</div>
<div><span style="font-weight:400;"><span></span></span></div>
<div><span style="font-weight:400;"><span>The national indicator is defined differently as the proportion of children, nonsmoking adolescents, and nonsmoking adults aged 3 years and over who had a serum cotinine level greater than or equal to 0.05 ng/mL and less than or equal to 10 ng/ml. </span>The data source for the national indicator is the National Health and Nutrition Examination Survey, which is not conducted in Hawaiʻi. The state data source is the Behavioral Risk Factor Surveillance System, which is self-reported data and only includes adults ages 18+.</span></div>
State: Hawaii Teens Exposed to Secondhand Smoke
State: Hawaii Teens Exposed to Secondhand Smoke
30.9%
(2019)
Compared to:
Prior Value
(23.8%)
Prior Value compares a measured value with the previously measured value. Confidence intervals were taken into account in determining the direction of the comparison.
Trend
This comparison measures the indicator’s values over multiple time periods.<br>The Mann-Kendall Test for Statistical Significance is used to evaluate the trend<br>over 4 to 10 periods of measure, subject to data availability and comparability.
State: Hawaii Young Teen Nonsmokers Exposed to Secondhand Smoke
State: Hawaii Young Teen Nonsmokers Exposed to Secondhand Smoke
27.9%
(2019)
Compared to:
Prior Value
(25.6%)
Prior Value compares a measured value with the previously measured value. Confidence intervals were taken into account in determining the direction of the comparison.
Trend
This comparison measures the indicator’s values over multiple time periods.<br>The Mann-Kendall Test for Statistical Significance is used to evaluate the trend<br>over 4 to 10 periods of measure, subject to data availability and comparability.
TPC Plan Target
(0%)
Diabetes
Diabetes
State: Hawaii
Value
Compared to:
State: Hawaii Adults with Prediabetes
State: Hawaii Adults with Prediabetes
15.0%
(2022)
Compared to:

Prior Value
(16.4%)
Prior Value compares a measured value with the previously measured value. Confidence intervals were taken into account in determining the direction of the comparison.
Trend
This comparison measures the indicator’s values over multiple time periods.<br>The Mann-Kendall Test for Statistical Significance is used to evaluate the trend<br>over 4 to 10 periods of measure, subject to data availability and comparability.
Asthma
Asthma
State: Hawaii
Value
Compared to:
State: Hawaii Hospitalizations for Asthma Among Children 0-4
State: Hawaii Hospitalizations for Asthma Among Children 0-4
10.2
Hospitalizations per 10,000 population < 5 yrs
(2022)
Compared to:

Prior Value
(4.1)
Prior Value compares a measured value with the previously measured value. Confidence intervals were taken into account in determining the direction of the comparison.
Trend
This comparison measures the indicator’s values over multiple time periods.<br>The Mann-Kendall Test for Statistical Significance is used to evaluate the trend<br>over 4 to 10 periods of measure, subject to data availability and comparability.
Asthma Plan Target
(6.7)
State: Hawaii Hospitalizations for Asthma 5-64 yrs
State: Hawaii Hospitalizations for Asthma 5-64 yrs
2.0
Hospitalizations per 10,000 population 5-64 yrs
(2022)
Compared to:
Prior Value
(1.2)
Prior Value compares a measured value with the previously measured value. Confidence intervals were taken into account in determining the direction of the comparison.
Trend
This comparison measures the indicator’s values over multiple time periods.<br>The Mann-Kendall Test for Statistical Significance is used to evaluate the trend<br>over 4 to 10 periods of measure, subject to data availability and comparability.
Asthma Plan Target
(2.4)
State: Hawaii Hospitalizations for Asthma among Adults 65+
State: Hawaii Hospitalizations for Asthma among Adults 65+
1.7
Hospitalizations per 10,000 population 65+ yrs
(2022)
Compared to:
Prior Value
(1.7)
Prior Value compares a measured value with the previously measured value. Confidence intervals were taken into account in determining the direction of the comparison.
Trend
This comparison measures the indicator’s values over multiple time periods.<br>The Mann-Kendall Test for Statistical Significance is used to evaluate the trend<br>over 4 to 10 periods of measure, subject to data availability and comparability.
Asthma Plan Target
(4.8)
State: Hawaii Asthma Death Rate <35 Yrs
State: Hawaii Asthma Death Rate <35 Yrs
2.7
Deaths per 1,000,000 population <35
(2006-2015)
Compared to:
US Value
(3.6)
The regional value is compared to the national value.
Prior Value
(3.2)
Prior Value compares a measured value with the previously measured value. Confidence intervals were not taken into account in determining the direction of the comparison.
Trend
This comparison measures the indicator’s values over multiple time periods.<br>The Mann-Kendall Test for Statistical Significance is used to evaluate the trend<br>over 4 to 10 periods of measure, subject to data availability and comparability.
State: Hawaii Asthma Death Rate 35-64 Yrs
State: Hawaii Asthma Death Rate 35-64 Yrs
28.8
Deaths per 1,000,000 population 35-64
(2016-2020)
Compared to:

US Value
(11.8)
The regional value is compared to the national value.
Prior Value
(19.5)
Prior Value compares a measured value with the previously measured value. Confidence intervals were taken into account in determining the direction of the comparison.
Trend
This comparison measures the indicator’s values over multiple time periods.<br>The Mann-Kendall Test for Statistical Significance is used to evaluate the trend<br>over 4 to 10 periods of measure, subject to data availability and comparability.
State: Hawaii Asthma Death Rate 65+ Yrs
State: Hawaii Asthma Death Rate 65+ Yrs
47.6
Deaths per 1,000,000 population 65+
(2016-2020)
Compared to:
US Value
(29.3)
The regional value is compared to the national value.
Prior Value
(44.3)
Prior Value compares a measured value with the previously measured value. Confidence intervals were taken into account in determining the direction of the comparison.
Trend
This comparison measures the indicator’s values over multiple time periods.<br>The Mann-Kendall Test for Statistical Significance is used to evaluate the trend<br>over 4 to 10 periods of measure, subject to data availability and comparability.
Cancer
Cancer
State: Hawaii
Value
Compared to:
State: Hawaii Women 21-65 Who Had a Pap Test
State: Hawaii Women 21-65 Who Had a Pap Test
76.1%
(2020)
Compared to:
Median Value for States and Territories
(77.7%)
The regional value is compared to the median value for states and territories.
Prior Value
(82.7%)
Prior Value compares a measured value with the previously measured value. Confidence intervals were taken into account in determining the direction of the comparison.
Trend
This comparison measures the indicator’s values over multiple time periods.<br>The Mann-Kendall Test for Statistical Significance is used to evaluate the trend<br>over 4 to 10 periods of measure, subject to data availability and comparability.
Cancer Plan Target
(83.7%)
