
Search for Indicators
All Data
Indicator Gauge Icon Legend
Legend Colors
Red is bad, green is good, blue is not statistically different/neutral.
Compared to Distribution
 the value is in the best half of communities.
 the value is in the 2nd worst quarter of communities.
 the value is in the worst quarter of communities.
Compared to Target
 meets target;
  does not meet target.
Compared to a Single Value
 lower than the comparison value;
 higher than the comparison value;
 not statistically different from comparison value.
Trend

 non-significant change over time;
 significant change over time;
  no change over time.
Compared to Prior Value
 higher than the previous measurement period;
 lower than the previous measurement period;
 no statistically different change from previous measurement period.
State: Hawaii
Health / Maternal, Fetal & Infant Health
Value
Compared to:
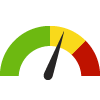
State: Hawaii Babies with Very Low Birth Weight
State: Hawaii Babies with Very Low Birth Weight
1.3%
(2022)
Compared to:

US Value
(1.4% in 2021)
The regional value is compared to the national value.
Prior Value
(1.3%)
Prior Value compares a measured value with the previously measured value. Confidence intervals were taken into account in determining the direction of the comparison.
Trend
This comparison measures the indicator’s values over multiple time periods.<br>The Mann-Kendall Test for Statistical Significance is used to evaluate the trend<br>over 4 to 10 periods of measure, subject to data availability and comparability.
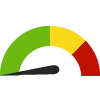
State: Hawaii Birth Rate
State: Hawaii Birth Rate
10.8
Births per 1,000 population
(2022)
Compared to:


US Value
(11.0 in 2021)
The regional value is compared to the national value.
Prior Value
(10.8)
Prior Value compares a measured value with the previously measured value. Confidence intervals were taken into account in determining the direction of the comparison.
Trend
This comparison measures the indicator’s values over multiple time periods.<br>The Mann-Kendall Test for Statistical Significance is used to evaluate the trend<br>over 4 to 10 periods of measure, subject to data availability and comparability.
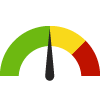
State: Hawaii Births Delivered by Cesarean Section
State: Hawaii Births Delivered by Cesarean Section
27.6%
(2022)
Compared to:

US Value
(32.1%)
The regional value is compared to the national value.
Prior Value
(27.7%)
Prior Value compares a measured value with the previously measured value. Confidence intervals were not taken into account in determining the direction of the comparison.
Trend
This comparison measures the indicator’s values over multiple time periods.<br>The Mann-Kendall Test for Statistical Significance is used to evaluate the trend<br>over 4 to 10 periods of measure, subject to data availability and comparability.
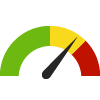
State: Hawaii Births Delivered by Primary Cesarean Section
State: Hawaii Births Delivered by Primary Cesarean Section
13.8%
(2022)
Compared to:

US Value
(14.6%)
The regional value is compared to the national value.
Prior Value
(12.9%)
Prior Value compares a measured value with the previously measured value. Confidence intervals were not taken into account in determining the direction of the comparison.
Trend
This comparison measures the indicator’s values over multiple time periods.<br>The Mann-Kendall Test for Statistical Significance is used to evaluate the trend<br>over 4 to 10 periods of measure, subject to data availability and comparability.
State: Hawaii Births Occurring in Baby-Friendly Facilities
State: Hawaii Births Occurring in Baby-Friendly Facilities
12.1%
(2021)
Compared to:

US Value
(18.3% in 2016)
The regional value is compared to the national value.
Prior Value
(12.1%)
Prior Value compares a measured value with the previously measured value. Confidence intervals were not taken into account in determining the direction of the comparison.
Trend
This comparison measures the indicator’s values over multiple time periods.<br>The Mann-Kendall Test for Statistical Significance is used to evaluate the trend<br>over 4 to 10 periods of measure, subject to data availability and comparability.
PAN Plan Target
(13.2%)
State: Hawaii Children with Special HC Needs in Family-Centered Care
State: Hawaii Children with Special HC Needs in Family-Centered Care
85.1%
(2020-2021)
Compared to:

US Value
(82.7%)
The regional value is compared to the national value.
Prior Value
(89.7%)
Prior Value compares a measured value with the previously measured value. Confidence intervals were taken into account in determining the direction of the comparison.
Trend
This comparison measures the indicator’s values over multiple time periods.<br>The Mann-Kendall Test for Statistical Significance is used to evaluate the trend<br>over 4 to 10 periods of measure, subject to data availability and comparability.
State: Hawaii Fetal Deaths
State: Hawaii Fetal Deaths
5.4
Deaths per 1,000 live births + fetal deaths
(2022)
Compared to:
US Value
(5.7 in 2020)
The regional value is compared to the national value.
Prior Value
(6.4)
Prior Value compares a measured value with the previously measured value. Confidence intervals were not taken into account in determining the direction of the comparison.
Trend
This comparison measures the indicator’s values over multiple time periods.<br>The Mann-Kendall Test for Statistical Significance is used to evaluate the trend<br>over 4 to 10 periods of measure, subject to data availability and comparability.
State: Hawaii HIV Test During Pregnancy
State: Hawaii HIV Test During Pregnancy
62.6%
(2015)
Compared to:

US Value
(65.2% in 2011)
The regional value is compared to the U.S. value.
Prior Value
(62.2%)
Prior Value compares a measured value with the previously measured value. Confidence intervals were taken into account in determining the direction of the comparison.
Trend
This comparison measures the indicator’s values over multiple time periods.<br>The Mann-Kendall Test for Statistical Significance is used to evaluate the trend<br>over 4 to 10 periods of measure, subject to data availability and comparability.
State: Hawaii Infant Deaths Due to All Birth Defects
State: Hawaii Infant Deaths Due to All Birth Defects
0.9
Deaths per 1,000 live births
(2020-2022)
Compared to:
US Value
(1.1 in 2019-2021)
The regional value is compared to the national value.
Prior Value
(0.8)
Prior Value compares a measured value with the previously measured value. Confidence intervals were taken into account in determining the direction of the comparison.
Trend
This comparison measures the indicator’s values over multiple time periods.<br>The Mann-Kendall Test for Statistical Significance is used to evaluate the trend<br>over 4 to 10 periods of measure, subject to data availability and comparability.
State: Hawaii Infant Deaths Due to Sudden Infant Death Syndrome (SIDS)
State: Hawaii Infant Deaths Due to Sudden Infant Death Syndrome (SIDS)
0.3
Deaths per 1,000 live births
(2018-2022)
Compared to:
US Value
(0.4 in 2019-2021)
The regional value is compared to the national value.
Prior Value
(0.3)
Prior Value compares a measured value with the previously measured value. Confidence intervals were taken into account in determining the direction of the comparison.
Trend
This comparison measures the indicator’s values over multiple time periods.<br>The Mann-Kendall Test for Statistical Significance is used to evaluate the trend<br>over 4 to 10 periods of measure, subject to data availability and comparability.
State: Hawaii Infant Deaths Due to Sudden Unexpected Infant Deaths
State: Hawaii Infant Deaths Due to Sudden Unexpected Infant Deaths
0.6
Deaths per 1,000 live births
(2020-2022)
Compared to:
US Value
(0.9 in 2019-2021)
The regional value is compared to the national value.
Prior Value
(0.6)
Prior Value compares a measured value with the previously measured value. Confidence intervals were taken into account in determining the direction of the comparison.
Trend
This comparison measures the indicator’s values over multiple time periods.<br>The Mann-Kendall Test for Statistical Significance is used to evaluate the trend<br>over 4 to 10 periods of measure, subject to data availability and comparability.
State: Hawaii Infant Mortality Rate
State: Hawaii Infant Mortality Rate
4.5
Deaths per 1,000 live births
(2019-2021)
Compared to:
US Value
(5.6 in 2022)
The regional value is compared to the national value.
Prior Value
(5.3)
Prior Value compares a measured value with the previously measured value. Confidence intervals were taken into account in determining the direction of the comparison.
Trend
This comparison measures the indicator’s values over multiple time periods.<br>The Mann-Kendall Test for Statistical Significance is used to evaluate the trend<br>over 4 to 10 periods of measure, subject to data availability and comparability.
HP 2030 LHI
(5.0)
<div><span>MICH-02: Reduce the rate of infant deaths <strong>(LEADING HEALTH INDICATOR) </strong><br /><br />The national indicator definition and data source are the same as for the state.</span></div>
State: Hawaii Infants Still Breastfeeding at 8 Weeks
State: Hawaii Infants Still Breastfeeding at 8 Weeks
80.9%
(2021)
Compared to:
US Value
(68.5% in 2020)
The regional value is compared to the national value.
Prior Value
(85.8%)
Prior Value compares a measured value with the previously measured value. Confidence intervals were taken into account in determining the direction of the comparison.
Trend
This comparison measures the indicator’s values over multiple time periods.<br>The Mann-Kendall Test for Statistical Significance is used to evaluate the trend<br>over 4 to 10 periods of measure, subject to data availability and comparability.
PAN Plan Target
(94.4%)
State: Hawaii Infants Who Are Put to Sleep on Their Backs
State: Hawaii Infants Who Are Put to Sleep on Their Backs
83.0%
(2021)
Compared to:
US Value
(79.5% in 2020)
The regional value is compared to the national value.
Prior Value
(80.1%)
Prior Value compares a measured value with the previously measured value. Confidence intervals were taken into account in determining the direction of the comparison.
Trend
This comparison measures the indicator’s values over multiple time periods.<br>The Mann-Kendall Test for Statistical Significance is used to evaluate the trend<br>over 4 to 10 periods of measure, subject to data availability and comparability.
State: Hawaii Infants Who Were Breastfed at 12 Months
State: Hawaii Infants Who Were Breastfed at 12 Months
47.3%
(2020)
Compared to:
US Value
(37.6%)
The regional value is compared to the national value.
Prior Value
(54.1%)
Prior Value compares a measured value with the previously measured value. Confidence intervals were taken into account in determining the direction of the comparison.
Trend
This comparison measures the indicator’s values over multiple time periods.<br>The Mann-Kendall Test for Statistical Significance is used to evaluate the trend<br>over 4 to 10 periods of measure, subject to data availability and comparability.
HP 2030 Target
(54.1%)
<div>MICH-16: Increase the proportion of infants who are breastfed at 1 year</div>
<div> </div>
<div>The national indicator definition and data source are the same as for the state.</div>
State: Hawaii Infants Who Were Breastfed at 6 Months
State: Hawaii Infants Who Were Breastfed at 6 Months
68.4%
(2020)
Compared to:
US Value
(58.2%)
The regional value is compared to the national value.
Prior Value
(70.9%)
Prior Value compares a measured value with the previously measured value. Confidence intervals were taken into account in determining the direction of the comparison.
Trend
This comparison measures the indicator’s values over multiple time periods.<br>The Mann-Kendall Test for Statistical Significance is used to evaluate the trend<br>over 4 to 10 periods of measure, subject to data availability and comparability.
PAN Plan Target
(60.6%)
State: Hawaii Infants Who Were Breastfed Exclusively Through 3 Months
State: Hawaii Infants Who Were Breastfed Exclusively Through 3 Months
51.8%
(2020)
Compared to:
US Value
(45.3%)
The regional value is compared to the national value.
Prior Value
(50.6%)
Prior Value compares a measured value with the previously measured value. Confidence intervals were taken into account in determining the direction of the comparison.
Trend
This comparison measures the indicator’s values over multiple time periods.<br>The Mann-Kendall Test for Statistical Significance is used to evaluate the trend<br>over 4 to 10 periods of measure, subject to data availability and comparability.
PAN Plan Target
(56.2%)
State: Hawaii Infants Who Were Breastfed Exclusively Through 6 Months
State: Hawaii Infants Who Were Breastfed Exclusively Through 6 Months
26.6%
(2020)
Compared to:
US Value
(25.4%)
The regional value is compared to the national value.
Prior Value
(27.7%)
Prior Value compares a measured value with the previously measured value. Confidence intervals were taken into account in determining the direction of the comparison.
Trend
This comparison measures the indicator’s values over multiple time periods.<br>The Mann-Kendall Test for Statistical Significance is used to evaluate the trend<br>over 4 to 10 periods of measure, subject to data availability and comparability.
HP 2030 Target
(42.4%)
<div>
<div>
<div>MICH-15: Increase the proportion of infants who are breastfed exclusively through age 6 months</div>
</div>
<div> </div>
<div>
<div>The national indicator definition and data source are the same as for the state.</div>
</div>
</div>
PAN Plan Target
(42.4%)
State: Hawaii Infants Who Were Ever Breastfed
State: Hawaii Infants Who Were Ever Breastfed
89.2%
(2020)
Compared to:
US Value
(83.1%)
The regional value is compared to the national value.
Prior Value
(90.1%)
Prior Value compares a measured value with the previously measured value. Confidence intervals were taken into account in determining the direction of the comparison.
Trend
This comparison measures the indicator’s values over multiple time periods.<br>The Mann-Kendall Test for Statistical Significance is used to evaluate the trend<br>over 4 to 10 periods of measure, subject to data availability and comparability.
PAN Plan Target
(93.6%)
State: Hawaii Maternal Mortality Rate
State: Hawaii Maternal Mortality Rate
16.9
Deaths per 100,000 live births
(2017-2021)
Compared to:
US Value
(32.9 in 2021)
The regional value is compared to the national value.
Prior Value
(12.9)
Prior Value compares a measured value with the previously measured value. Confidence intervals were taken into account in determining the direction of the comparison.
Trend
This comparison measures the indicator’s values over multiple time periods.<br>The Mann-Kendall Test for Statistical Significance is used to evaluate the trend<br>over 4 to 10 periods of measure, subject to data availability and comparability.
HP 2030 LHI
(15.7)
<div><span>MICH-04: Reduce maternal deaths <strong>(LEADING HEALTH INDICATOR)</strong><br /> <br />The national indicator definition and data source are the same as for the state.</span></div>
State: Hawaii Mothers Who Ever Breastfed
State: Hawaii Mothers Who Ever Breastfed
94.5%
(2021)
Compared to:
US Value
(87.9% in 2020)
The regional value is compared to the national value.
Prior Value
(96.5%)
Prior Value compares a measured value with the previously measured value. Confidence intervals were taken into account in determining the direction of the comparison.
Trend
This comparison measures the indicator’s values over multiple time periods.<br>The Mann-Kendall Test for Statistical Significance is used to evaluate the trend<br>over 4 to 10 periods of measure, subject to data availability and comparability.
PAN Plan Target
(100%)
State: Hawaii Mothers Who Gained Appropriate Weight During Pregnancy
State: Hawaii Mothers Who Gained Appropriate Weight During Pregnancy
36.9%
(2015)
Compared to:
Prior Value
(34.1%)
Prior Value compares a measured value with the previously measured value. Confidence intervals were taken into account in determining the direction of the comparison.
Trend
This comparison measures the indicator’s values over multiple time periods.<br>The Mann-Kendall Test for Statistical Significance is used to evaluate the trend<br>over 4 to 10 periods of measure, subject to data availability and comparability.
State: Hawaii Mothers Who Had a Postpartum Care Visit
State: Hawaii Mothers Who Had a Postpartum Care Visit
88.7%
(2021)
Compared to:
US Value
(88.1% in 2020)
The regional value is compared to the national value.
Prior Value
(90.5%)
Prior Value compares a measured value with the previously measured value. Confidence intervals were taken into account in determining the direction of the comparison.
Trend
This comparison measures the indicator’s values over multiple time periods.<br>The Mann-Kendall Test for Statistical Significance is used to evaluate the trend<br>over 4 to 10 periods of measure, subject to data availability and comparability.
State: Hawaii Mothers who Received Early and Adequate Prenatal Care
State: Hawaii Mothers who Received Early and Adequate Prenatal Care
62.1%
(2021)
Compared to:
US Value
(87.1% in 2020)
The regional value is compared to the national value.
Prior Value
(61.5%)
Prior Value compares a measured value with the previously measured value. Confidence intervals were taken into account in determining the direction of the comparison.
Trend
This comparison measures the indicator’s values over multiple time periods.<br>The Mann-Kendall Test for Statistical Significance is used to evaluate the trend<br>over 4 to 10 periods of measure, subject to data availability and comparability.
State: Hawaii Mothers who Received Late or No Prenatal Care
State: Hawaii Mothers who Received Late or No Prenatal Care
13.4%
(2022)
Compared to:

US Value
(6.3% in 2021)
The regional value is compared to the national value.
Prior Value
(11.3%)
Prior Value compares a measured value with the previously measured value. Confidence intervals were taken into account in determining the direction of the comparison.
Trend
This comparison measures the indicator’s values over multiple time periods.<br>The Mann-Kendall Test for Statistical Significance is used to evaluate the trend<br>over 4 to 10 periods of measure, subject to data availability and comparability.
State: Hawaii Mothers Who Smoked 3-6 Months Postpartum
State: Hawaii Mothers Who Smoked 3-6 Months Postpartum
3.8%
(2021)
Compared to:
US Value
(8.8% in 2020)
The regional value is compared to the national value.
Prior Value
(4.1%)
Prior Value compares a measured value with the previously measured value. Confidence intervals were taken into account in determining the direction of the comparison.
Trend
This comparison measures the indicator’s values over multiple time periods.<br>The Mann-Kendall Test for Statistical Significance is used to evaluate the trend<br>over 4 to 10 periods of measure, subject to data availability and comparability.
State: Hawaii Mothers Who Smoked in the Last Trimester of Pregnancy
State: Hawaii Mothers Who Smoked in the Last Trimester of Pregnancy
3.7%
(2021)
Compared to:
US Value
(6.5% in 2020)
The regional value is compared to the national value.
Prior Value
(3.0%)
Prior Value compares a measured value with the previously measured value. Confidence intervals were taken into account in determining the direction of the comparison.
Trend
This comparison measures the indicator’s values over multiple time periods.<br>The Mann-Kendall Test for Statistical Significance is used to evaluate the trend<br>over 4 to 10 periods of measure, subject to data availability and comparability.
State: Hawaii Neonatal Mortality Rate
State: Hawaii Neonatal Mortality Rate
3.2
Deaths per 1,000 live births
(2021)
Compared to:
US Value
(3.5)
The regional value is compared to the national value.
Prior Value
(3.0)
Prior Value compares a measured value with the previously measured value. Confidence intervals were taken into account in determining the direction of the comparison.
Trend
This comparison measures the indicator’s values over multiple time periods.<br>The Mann-Kendall Test for Statistical Significance is used to evaluate the trend<br>over 4 to 10 periods of measure, subject to data availability and comparability.
16.2%
(2019)
Compared to:
US Value
(19.2%)
The regional value is compared to the national value.
Prior Value
(17.5%)
Prior Value compares a measured value with the previously measured value. Confidence intervals were taken into account in determining the direction of the comparison.
Trend
This comparison measures the indicator’s values over multiple time periods.<br>The Mann-Kendall Test for Statistical Significance is used to evaluate the trend<br>over 4 to 10 periods of measure, subject to data availability and comparability.
State: Hawaii Postpartum Relapse of Smoking
State: Hawaii Postpartum Relapse of Smoking
19.0%
(2021)
Compared to:
Prior Value
(19.3%)
Prior Value compares a measured value with the previously measured value. Confidence intervals were taken into account in determining the direction of the comparison.
Trend
This comparison measures the indicator’s values over multiple time periods.<br>The Mann-Kendall Test for Statistical Significance is used to evaluate the trend<br>over 4 to 10 periods of measure, subject to data availability and comparability.
State: Hawaii Pregnant Women who Abstained from Binge Drinking
State: Hawaii Pregnant Women who Abstained from Binge Drinking
89.0%
(2015-2018)
Compared to:
US Value
(95.4%)
The regional value is compared to the national value.
Prior Value
(95.4%)
Prior Value compares a measured value with the previously measured value. Confidence intervals were taken into account in determining the direction of the comparison.
State: Hawaii Preterm Births
State: Hawaii Preterm Births
9.8%
(2022)
Compared to:
US Value
(10.5% in 2021)
The regional value is compared to the national value.
Prior Value
(10.2%)
Prior Value compares a measured value with the previously measured value. Confidence intervals were taken into account in determining the direction of the comparison.
Trend
This comparison measures the indicator’s values over multiple time periods.<br>The Mann-Kendall Test for Statistical Significance is used to evaluate the trend<br>over 4 to 10 periods of measure, subject to data availability and comparability.
HP 2030 Target
(9.4%)
<div><span>MICH-07: Reduce preterm births<br /> <br />The national indicator definition and data source are the same as for the state.</span></div>
92.6%
(2021)
Compared to:
US Value
(92.0% in 2015)
The regional value is compared to the national value.
Prior Value
(93.4%)
Prior Value compares a measured value with the previously measured value. Confidence intervals were taken into account in determining the direction of the comparison.
Trend
This comparison measures the indicator’s values over multiple time periods.<br>The Mann-Kendall Test for Statistical Significance is used to evaluate the trend<br>over 4 to 10 periods of measure, subject to data availability and comparability.
HP 2030 Target
(92.2%)
<div>
<div><a target="_blank" href="http://www.healthypeople.gov/node/4836/data_details" rel="noreferrer noopener"><span>MICH-09: </span> <span>Increase abstinence from alcohol among pregnant women</span></a></div>
<div> </div>
<div>The national indicator is defined differently as the percent of pregnant females ages 15 to 44 years who report no alcohol use in the previous 30 days. The data source for the national indicator is the National Survey on Drug Use and Health. The state data source is the Pregnancy Risk Assessment Monitoring System.</div>
</div>
State: Hawaii Women Who Abstained from Drinking Prior to Pregnancy
State: Hawaii Women Who Abstained from Drinking Prior to Pregnancy
43.5%
(2021)
Compared to:
US Value
(44.7% in 2015)
The regional value is compared to the national value.
Prior Value
(44.7%)
Prior Value compares a measured value with the previously measured value. Confidence intervals were taken into account in determining the direction of the comparison.
Trend
This comparison measures the indicator’s values over multiple time periods.<br>The Mann-Kendall Test for Statistical Significance is used to evaluate the trend<br>over 4 to 10 periods of measure, subject to data availability and comparability.
State: Hawaii Women Who Abstained from Illicit Drugs During Pregnancy
State: Hawaii Women Who Abstained from Illicit Drugs During Pregnancy
96.6%
(2011)
Compared to:
Prior Value
(97.5%)
Prior Value compares a measured value with the previously measured value. Confidence intervals were taken into account in determining the direction of the comparison.
Trend
This comparison measures the indicator’s values over multiple time periods.<br>The Mann-Kendall Test for Statistical Significance is used to evaluate the trend<br>over 4 to 10 periods of measure, subject to data availability and comparability.
94.6%
(2015)
Compared to:
Prior Value
(94.7%)
Prior Value compares a measured value with the previously measured value. Confidence intervals were taken into account in determining the direction of the comparison.
Trend
This comparison measures the indicator’s values over multiple time periods.<br>The Mann-Kendall Test for Statistical Significance is used to evaluate the trend<br>over 4 to 10 periods of measure, subject to data availability and comparability.
State: Hawaii Women Who Abstained from Smoking Prior to Pregnancy
State: Hawaii Women Who Abstained from Smoking Prior to Pregnancy
90.6%
(2021)
Compared to:
US Value
(86.0% in 2020)
The regional value is compared to the national value.
Prior Value
(90.4%)
Prior Value compares a measured value with the previously measured value. Confidence intervals were taken into account in determining the direction of the comparison.
Trend
This comparison measures the indicator’s values over multiple time periods.<br>The Mann-Kendall Test for Statistical Significance is used to evaluate the trend<br>over 4 to 10 periods of measure, subject to data availability and comparability.
State: Hawaii Women who Binge Drink Prior to Pregnancy
State: Hawaii Women who Binge Drink Prior to Pregnancy
18.3%
(2021)
Compared to:
US Value
(3.0% in 2020)
The regional value is compared to the national value.
Prior Value
(19.2%)
Prior Value compares a measured value with the previously measured value. Confidence intervals were taken into account in determining the direction of the comparison.
Trend
This comparison measures the indicator’s values over multiple time periods.<br>The Mann-Kendall Test for Statistical Significance is used to evaluate the trend<br>over 4 to 10 periods of measure, subject to data availability and comparability.
State: Hawaii Women Who Discussed Effects of Smoking with a HCW
State: Hawaii Women Who Discussed Effects of Smoking with a HCW
72.1%
(2015)
Compared to:
Prior Value
(71.0%)
Prior Value compares a measured value with the previously measured value. Confidence intervals were taken into account in determining the direction of the comparison.
Trend
This comparison measures the indicator’s values over multiple time periods.<br>The Mann-Kendall Test for Statistical Significance is used to evaluate the trend<br>over 4 to 10 periods of measure, subject to data availability and comparability.
State: Hawaii Women Who Discussed Preconception Health with a HCW
State: Hawaii Women Who Discussed Preconception Health with a HCW
40.7%
(2011)
Compared to:
US Value
(33.6%)
The regional value is compared to the U.S. value.
Prior Value
(37.3%)
Prior Value compares a measured value with the previously measured value. Confidence intervals were taken into account in determining the direction of the comparison.
7.4%
(2021)
Compared to:
Prior Value
(6.6%)
Prior Value compares a measured value with the previously measured value. Confidence intervals were taken into account in determining the direction of the comparison.
Trend
This comparison measures the indicator’s values over multiple time periods.<br>The Mann-Kendall Test for Statistical Significance is used to evaluate the trend<br>over 4 to 10 periods of measure, subject to data availability and comparability.
State: Hawaii Women Who Had a Healthy Body Weight Prior to Pregnancy
State: Hawaii Women Who Had a Healthy Body Weight Prior to Pregnancy
48.1%
(2021)
Compared to:
US Value
(43.0% in 2020)
The regional value is compared to the national value.
Prior Value
(45.2%)
Prior Value compares a measured value with the previously measured value. Confidence intervals were taken into account in determining the direction of the comparison.
Trend
This comparison measures the indicator’s values over multiple time periods.<br>The Mann-Kendall Test for Statistical Significance is used to evaluate the trend<br>over 4 to 10 periods of measure, subject to data availability and comparability.
State: Hawaii Women Who Quit Smoking Cigarettes During Pregnancy
State: Hawaii Women Who Quit Smoking Cigarettes During Pregnancy
61.1%
(2021)
Compared to:
Prior Value
(68.4%)
Prior Value compares a measured value with the previously measured value. Confidence intervals were taken into account in determining the direction of the comparison.
Trend
This comparison measures the indicator’s values over multiple time periods.<br>The Mann-Kendall Test for Statistical Significance is used to evaluate the trend<br>over 4 to 10 periods of measure, subject to data availability and comparability.
HP 2030 Target
(24.4%)
<div>
<div>TU-15: Increase successful quit attempts in pregnant women who smoke cigarettes </div>
<div> </div>
<div>The national indicator is defined as the percent of females who reported smoking cigarettes <span>at any time during the first and/or second trimester and reported not smoking during the third trimester of their pregnancy</span>. The data source for the national indicator is the National Vital Statistics System. The state data source is the Pregnancy Risk Assessment Monitoring System, which is comparable to the national data source.</div>
</div>
State: Hawaii Women Who Took Folic Acid or Vitamins Prior to Pregnancy
State: Hawaii Women Who Took Folic Acid or Vitamins Prior to Pregnancy
45.1%
(2021)
Compared to:
US Value
(43.6% in 2020)
The regional value is compared to the national value.
Prior Value
(43.6%)
Prior Value compares a measured value with the previously measured value. Confidence intervals were taken into account in determining the direction of the comparison.
Trend
This comparison measures the indicator’s values over multiple time periods.<br>The Mann-Kendall Test for Statistical Significance is used to evaluate the trend<br>over 4 to 10 periods of measure, subject to data availability and comparability.
State: Hawaii
Health / Medications & Prescriptions
Value
Compared to:
State: Hawaii Adults who Bought Medications for Anxiety or Depression
State: Hawaii Adults who Bought Medications for Anxiety or Depression
13.6%
(2023)
Compared to:

US Value
(14.9%)
The regional value is compared to the national value.
Prior Value
(13.7%)
Prior Value compares a measured value with the previously measured value. Confidence intervals were not taken into account in determining the direction of the comparison.
State: Hawaii
Health / Mental Health & Mental Disorders
Value
Compared to:
State: Hawaii Adolescents who Experience Major Depressive Episodes
State: Hawaii Adolescents who Experience Major Depressive Episodes
19.2%
(2021)
Compared to:
US Value
(20.1%)
The regional value is compared to the national value.
Prior Value
(14.2%)
Prior Value compares a measured value with the previously measured value. Confidence intervals were taken into account in determining the direction of the comparison.
Trend
This comparison measures the indicator’s values over multiple time periods.<br>The Mann-Kendall Test for Statistical Significance is used to evaluate the trend<br>over 4 to 10 periods of measure, subject to data availability and comparability.
18.8%
(2018-2019)
Compared to:
US Value
(42.5%)
The regional value is compared to the national value.
Prior Value
(25.7%)
Prior Value compares a measured value with the previously measured value. Confidence intervals were taken into account in determining the direction of the comparison.
HP 2030 LHI
(46.4%)
<div><span>MHMD-06: Increase the proportion of adolescents with depression who get treatment <strong>(LEADING HEALTH INDICATOR)</strong><br /> <br />The national indicator definition and data source are the same as for the state.</span></div>
State: Hawaii Adult Poor Mental Health: 14+ Days
State: Hawaii Adult Poor Mental Health: 14+ Days
11.5%
(2022)
Compared to:
Median Value for States and Territories
(15.7%)
The regional value is compared to the median value for states and territories.
Prior Value
(10.7%)
Prior Value compares a measured value with the previously measured value. Confidence intervals were taken into account in determining the direction of the comparison.
Trend
This comparison measures the indicator’s values over multiple time periods.<br>The Mann-Kendall Test for Statistical Significance is used to evaluate the trend<br>over 4 to 10 periods of measure, subject to data availability and comparability.
State: Hawaii Adults Ever Diagnosed with Depression
State: Hawaii Adults Ever Diagnosed with Depression
12.5%
(2022)
Compared to:
Median Value for States and Territories
(21.6%)
The regional value is compared to the median value for states and territories.
Prior Value
(11.1%)
Prior Value compares a measured value with the previously measured value. Confidence intervals were taken into account in determining the direction of the comparison.
Trend
This comparison measures the indicator’s values over multiple time periods.<br>The Mann-Kendall Test for Statistical Significance is used to evaluate the trend<br>over 4 to 10 periods of measure, subject to data availability and comparability.
State: Hawaii Adults who Experience Major Depressive Episodes
State: Hawaii Adults who Experience Major Depressive Episodes
6.8%
(2021)
Compared to:
US Value
(8.3%)
The regional value is compared to the national value.
Prior Value
(5.8%)
Prior Value compares a measured value with the previously measured value. Confidence intervals were taken into account in determining the direction of the comparison.
Trend
This comparison measures the indicator’s values over multiple time periods.<br>The Mann-Kendall Test for Statistical Significance is used to evaluate the trend<br>over 4 to 10 periods of measure, subject to data availability and comparability.
State: Hawaii Adults Who Grew Up with Drug Use in Household
State: Hawaii Adults Who Grew Up with Drug Use in Household
11.8%
(2020)
Compared to:
Prior Value
(10.9%)
Prior Value compares a measured value with the previously measured value. Confidence intervals were taken into account in determining the direction of the comparison.
State: Hawaii Adults Who Grew Up with Mental Illness in Household
State: Hawaii Adults Who Grew Up with Mental Illness in Household
13.5%
(2020)
Compared to:
Prior Value
(13.9%)
Prior Value compares a measured value with the previously measured value. Confidence intervals were taken into account in determining the direction of the comparison.
State: Hawaii Adults Who Grew Up with Problem Drinking in Household
State: Hawaii Adults Who Grew Up with Problem Drinking in Household
19.4%
(2020)
Compared to:
Prior Value
(20.2%)
Prior Value compares a measured value with the previously measured value. Confidence intervals were taken into account in determining the direction of the comparison.
State: Hawaii Adults with 4+ Adverse Childhood Experiences
State: Hawaii Adults with 4+ Adverse Childhood Experiences
15.3%
(2020)
Compared to:
Prior Value
(14.5%)
Prior Value compares a measured value with the previously measured value. Confidence intervals were taken into account in determining the direction of the comparison.
50.1%
(2015-2018)
Compared to:
US Value
(56.0%)
The regional value is compared to the national value.
Prior Value
(38.2%)
Prior Value compares a measured value with the previously measured value. Confidence intervals were taken into account in determining the direction of the comparison.
Trend
This comparison measures the indicator’s values over multiple time periods.<br>The Mann-Kendall Test for Statistical Significance is used to evaluate the trend<br>over 4 to 10 periods of measure, subject to data availability and comparability.
57.6%
(2015-2018)
Compared to:
US Value
(65.5%)
The regional value is compared to the national value.
Prior Value
(54.6%)
Prior Value compares a measured value with the previously measured value. Confidence intervals were taken into account in determining the direction of the comparison.
Trend
This comparison measures the indicator’s values over multiple time periods.<br>The Mann-Kendall Test for Statistical Significance is used to evaluate the trend<br>over 4 to 10 periods of measure, subject to data availability and comparability.
11.4%
(2020-2021)
Compared to:
US Value
(11.5%)
The regional value is compared to the national value.
Prior Value
(12.4%)
Prior Value compares a measured value with the previously measured value. Confidence intervals were taken into account in determining the direction of the comparison.
Trend
This comparison measures the indicator’s values over multiple time periods.<br>The Mann-Kendall Test for Statistical Significance is used to evaluate the trend<br>over 4 to 10 periods of measure, subject to data availability and comparability.
64.9%
(2020-2021)
Compared to:
US Value
(53.0%)
The regional value is compared to the national value.
Prior Value
(66.8%)
Prior Value compares a measured value with the previously measured value. Confidence intervals were taken into account in determining the direction of the comparison.
8.7%
(2020-2021)
Compared to:
US Value
(13.8%)
The regional value is compared to the national value.
Prior Value
(31.4%)
Prior Value compares a measured value with the previously measured value. Confidence intervals were taken into account in determining the direction of the comparison.
Trend
This comparison measures the indicator’s values over multiple time periods.<br>The Mann-Kendall Test for Statistical Significance is used to evaluate the trend<br>over 4 to 10 periods of measure, subject to data availability and comparability.
State: Hawaii Depression: Medicare Population
State: Hawaii Depression: Medicare Population
8.0%
(2022)
Compared to:
U.S. States
The distribution is based on data from 50 U.S. states and the District of Columbia.
US Value
(16.0%)
The regional value is compared to the national value.
Prior Value
(8.0%)
Prior Value compares a measured value with the previously measured value. Confidence intervals were not taken into account in determining the direction of the comparison.
Trend
This comparison measures the indicator’s values over multiple time periods.<br>The Mann-Kendall Test for Statistical Significance is used to evaluate the trend<br>over 4 to 10 periods of measure, subject to data availability and comparability.
State: Hawaii Households that Received Mental Healthcare Services
State: Hawaii Households that Received Mental Healthcare Services
8.5%
(2023)
Compared to:


US Value
(8.8%)
The regional value is compared to the national value.
Prior Value
(7.5%)
Prior Value compares a measured value with the previously measured value. Confidence intervals were not taken into account in determining the direction of the comparison.
Trend
This comparison measures the indicator’s values over multiple time periods.<br>The Mann-Kendall Test for Statistical Significance is used to evaluate the trend<br>over 4 to 10 periods of measure, subject to data availability and comparability.
State: Hawaii Mental Health Provider Rate
State: Hawaii Mental Health Provider Rate
299
Providers per 100,000 population
(2023)
Compared to:
U.S. States
The distribution is based on data from 50 U.S. states and the District of Columbia.
Prior Value
(284)
Prior Value compares a measured value with the previously measured value. Confidence intervals were not taken into account in determining the direction of the comparison.
Trend
This comparison measures the indicator’s values over multiple time periods.<br>The Mann-Kendall Test for Statistical Significance is used to evaluate the trend<br>over 4 to 10 periods of measure, subject to data availability and comparability.
State: Hawaii Mental Health Status of Father
State: Hawaii Mental Health Status of Father
78.3%
(2020-2021)
Compared to:
US Value
(77.1%)
The regional value is compared to the national value.
Prior Value
(77.6%)
Prior Value compares a measured value with the previously measured value. Confidence intervals were taken into account in determining the direction of the comparison.
Trend
This comparison measures the indicator’s values over multiple time periods.<br>The Mann-Kendall Test for Statistical Significance is used to evaluate the trend<br>over 4 to 10 periods of measure, subject to data availability and comparability.
State: Hawaii Mental Health Status of Mother
State: Hawaii Mental Health Status of Mother
74.9%
(2020-2021)
Compared to:
US Value
(70.5%)
The regional value is compared to the national value.
Prior Value
(72.9%)
Prior Value compares a measured value with the previously measured value. Confidence intervals were taken into account in determining the direction of the comparison.
Trend
This comparison measures the indicator’s values over multiple time periods.<br>The Mann-Kendall Test for Statistical Significance is used to evaluate the trend<br>over 4 to 10 periods of measure, subject to data availability and comparability.
51.1%
(2020-2021)
Compared to:
US Value
(58.8%)
The regional value is compared to the national value.
Prior Value
(51.2%)
Prior Value compares a measured value with the previously measured value. Confidence intervals were taken into account in determining the direction of the comparison.
Trend
This comparison measures the indicator’s values over multiple time periods.<br>The Mann-Kendall Test for Statistical Significance is used to evaluate the trend<br>over 4 to 10 periods of measure, subject to data availability and comparability.
State: Hawaii People with Serious Mental Illness who are Employed
State: Hawaii People with Serious Mental Illness who are Employed
55.1%
(2018-2019)
Compared to:
US Value
(59.9%)
The regional value is compared to the national value.
Prior Value
(52.1%)
Prior Value compares a measured value with the previously measured value. Confidence intervals were not taken into account in determining the direction of the comparison.
Trend
This comparison measures the indicator’s values over multiple time periods.<br>The Mann-Kendall Test for Statistical Significance is used to evaluate the trend<br>over 4 to 10 periods of measure, subject to data availability and comparability.
State: Hawaii Schools Requiring Education on Suicide Prevention
State: Hawaii Schools Requiring Education on Suicide Prevention
68.5%
(2016)
Compared to:
US Value
(80.2%)
The regional value is compared to the national median.
Prior Value
(60.1%)
Prior Value compares a measured value with the previously measured value. Confidence intervals were not taken into account in determining the direction of the comparison.
Trend
This comparison measures the indicator’s values over multiple time periods.<br>The Mann-Kendall Test for Statistical Significance is used to evaluate the trend<br>over 4 to 10 periods of measure, subject to data availability and comparability.
State: Hawaii Suicide Death Rate
State: Hawaii Suicide Death Rate
15.9
Deaths per 100,000 population
(2022)
Compared to:
US Value
(14.2 in 2021)
The regional value is compared to the national value.
Prior Value
(12.9)
Prior Value compares a measured value with the previously measured value. Confidence intervals were taken into account in determining the direction of the comparison.
Trend
This comparison measures the indicator’s values over multiple time periods.<br>The Mann-Kendall Test for Statistical Significance is used to evaluate the trend<br>over 4 to 10 periods of measure, subject to data availability and comparability.
HP 2030 LHI
(12.8)
<div><span>MHMD-01: Reduce the suicide rate <strong>(LEADING HEALTH INDICATOR)</strong><br /><br />The national indicator definition and data source are the same as for the state.</span></div>
State: Hawaii Teens Who Attempted Suicide
State: Hawaii Teens Who Attempted Suicide
1.8%
(2021)
Compared to:
US Value
(10.2%)
The regional value is compared to the national value.
Prior Value
(3.2%)
Prior Value compares a measured value with the previously measured value. Confidence intervals were taken into account in determining the direction of the comparison.
Trend
This comparison measures the indicator’s values over multiple time periods.<br>The Mann-Kendall Test for Statistical Significance is used to evaluate the trend<br>over 4 to 10 periods of measure, subject to data availability and comparability.
State: Hawaii Teens With Disordered Eating
State: Hawaii Teens With Disordered Eating
21.5%
(2019)
Compared to:
Prior Value
(21.1%)
Prior Value compares a measured value with the previously measured value. Confidence intervals were taken into account in determining the direction of the comparison.
Trend
This comparison measures the indicator’s values over multiple time periods.<br>The Mann-Kendall Test for Statistical Significance is used to evaluate the trend<br>over 4 to 10 periods of measure, subject to data availability and comparability.
State: Hawaii Women with Depression Before Pregnancy
State: Hawaii Women with Depression Before Pregnancy
9.1%
(2021)
Compared to:
Prior Value
(7.7%)
Prior Value compares a measured value with the previously measured value. Confidence intervals were taken into account in determining the direction of the comparison.
Trend
This comparison measures the indicator’s values over multiple time periods.<br>The Mann-Kendall Test for Statistical Significance is used to evaluate the trend<br>over 4 to 10 periods of measure, subject to data availability and comparability.
State: Hawaii Women with Post-Partum Depression
State: Hawaii Women with Post-Partum Depression
14.4%
(2021)
Compared to:
Prior Value
(13.7%)
Prior Value compares a measured value with the previously measured value. Confidence intervals were taken into account in determining the direction of the comparison.
Trend
This comparison measures the indicator’s values over multiple time periods.<br>The Mann-Kendall Test for Statistical Significance is used to evaluate the trend<br>over 4 to 10 periods of measure, subject to data availability and comparability.
State: Hawaii Young Teens Who Ever Attempted Suicide
State: Hawaii Young Teens Who Ever Attempted Suicide
3.2%
(2021)
Compared to:
Prior Value
(9.6%)
Prior Value compares a measured value with the previously measured value. Confidence intervals were taken into account in determining the direction of the comparison.
Trend
This comparison measures the indicator’s values over multiple time periods.<br>The Mann-Kendall Test for Statistical Significance is used to evaluate the trend<br>over 4 to 10 periods of measure, subject to data availability and comparability.
State: Hawaii Young Teens With Disordered Eating
State: Hawaii Young Teens With Disordered Eating
19.9%
(2019)
Compared to:
Prior Value
(14.3%)
Prior Value compares a measured value with the previously measured value. Confidence intervals were taken into account in determining the direction of the comparison.
Trend
This comparison measures the indicator’s values over multiple time periods.<br>The Mann-Kendall Test for Statistical Significance is used to evaluate the trend<br>over 4 to 10 periods of measure, subject to data availability and comparability.
State: Hawaii
Health / Mortality Data
Value
Compared to:
State: Hawaii All-Cause Mortality Rate
State: Hawaii All-Cause Mortality Rate
595.7
Deaths per 100,000 population
(2022)
Compared to:
US Value
(879.7 in 2021)
The regional value is compared to the national value.
Prior Value
(593.3)
Prior Value compares a measured value with the previously measured value. Confidence intervals were taken into account in determining the direction of the comparison.
Trend
This comparison measures the indicator’s values over multiple time periods.<br>The Mann-Kendall Test for Statistical Significance is used to evaluate the trend<br>over 4 to 10 periods of measure, subject to data availability and comparability.
State: Hawaii Deaths Among Youth Aged 1-19 Years
State: Hawaii Deaths Among Youth Aged 1-19 Years
18.9
Deaths per 100,000 population 1-19
(2019-2021)
Compared to:
US Value
(27.4)
The regional value is compared to the national value.
Prior Value
(19.6)
Prior Value compares a measured value with the previously measured value. Confidence intervals were taken into account in determining the direction of the comparison.
HP 2030 Target
(18.4)
<div><strong>MICH-03: </strong>Reduce the rate of deaths in children and adolescents ages 1 to 19 years</div>
<div> </div>
<div>The national indicator definition and data source are the same as for the state.</div>
State: Hawaii
Health / Nutrition & Healthy Eating
Value
Compared to:
State: Hawaii Adult Fruit and Vegetable Consumption
State: Hawaii Adult Fruit and Vegetable Consumption
14.6%
(2021)
Compared to:

Prior Value
(17.5%)
Prior Value compares a measured value with the previously measured value. Confidence intervals were taken into account in determining the direction of the comparison.
Trend
This comparison measures the indicator’s values over multiple time periods.<br>The Mann-Kendall Test for Statistical Significance is used to evaluate the trend<br>over 4 to 10 periods of measure, subject to data availability and comparability.
PAN Plan Target
(19.4%)
State: Hawaii Adults who Drank Soft Drinks: Past 7 Days
State: Hawaii Adults who Drank Soft Drinks: Past 7 Days
39.3%
(2023)
Compared to:
US Value
(43.7%)
The regional value is compared to the national value.
12.4%
(2022)
Compared to:
Prior Value
(11.1%)
Prior Value compares a measured value with the previously measured value. Confidence intervals were taken into account in determining the direction of the comparison.
Trend
This comparison measures the indicator’s values over multiple time periods.<br>The Mann-Kendall Test for Statistical Significance is used to evaluate the trend<br>over 4 to 10 periods of measure, subject to data availability and comparability.
PAN Plan Target
(10.4%)
State: Hawaii Adults who Frequently Cook Meals at Home
State: Hawaii Adults who Frequently Cook Meals at Home
80.0%
(2023)
Compared to:
US Value
(78.0%)
The regional value is compared to the national value.
Prior Value
(76.3%)
Prior Value compares a measured value with the previously measured value. Confidence intervals were not taken into account in determining the direction of the comparison.
38.3%
(2023)
Compared to:
U.S. States
The distribution is based on data from 50 U.S. states and the District of Columbia.
US Value
(40.4%)
The regional value is compared to the national value.
Prior Value
(38.6%)
Prior Value compares a measured value with the previously measured value. Confidence intervals were not taken into account in determining the direction of the comparison.
Trend
This comparison measures the indicator’s values over multiple time periods.<br>The Mann-Kendall Test for Statistical Significance is used to evaluate the trend<br>over 4 to 10 periods of measure, subject to data availability and comparability.
State: Hawaii Adults with Low Fruit Consumption
State: Hawaii Adults with Low Fruit Consumption
42.5%
(2021)
Compared to:
Median Value for States and Territories
(41.0%)
The regional value is compared to the median value for states and territories.
Prior Value
(40.3%)
Prior Value compares a measured value with the previously measured value. Confidence intervals were taken into account in determining the direction of the comparison.
Trend
This comparison measures the indicator’s values over multiple time periods.<br>The Mann-Kendall Test for Statistical Significance is used to evaluate the trend<br>over 4 to 10 periods of measure, subject to data availability and comparability.
State: Hawaii Adults with Low Vegetable Consumption
State: Hawaii Adults with Low Vegetable Consumption
21.9%
(2021)
Compared to:
Median Value for States and Territories
(19.8%)
The regional value is compared to the median value for states and territories.
Prior Value
(22.0%)
Prior Value compares a measured value with the previously measured value. Confidence intervals were taken into account in determining the direction of the comparison.
Trend
This comparison measures the indicator’s values over multiple time periods.<br>The Mann-Kendall Test for Statistical Significance is used to evaluate the trend<br>over 4 to 10 periods of measure, subject to data availability and comparability.
State: Hawaii Children Who Drank Soda with Sugar Yesterday
State: Hawaii Children Who Drank Soda with Sugar Yesterday
19.4%
(2022)
Compared to:
Prior Value
(12.4%)
Prior Value compares a measured value with the previously measured value. Confidence intervals were taken into account in determining the direction of the comparison.
PAN Plan Target
(11.3%)
State: Hawaii Children Who Drank Sugar-Sweetened Beverages Yesterday
State: Hawaii Children Who Drank Sugar-Sweetened Beverages Yesterday
42.9%
(2022)
Compared to:
Prior Value
(27.2%)
Prior Value compares a measured value with the previously measured value. Confidence intervals were taken into account in determining the direction of the comparison.
PAN Plan Target
(25.2%)
State: Hawaii Children Who Drank Sweetened Drinks Yesterday
State: Hawaii Children Who Drank Sweetened Drinks Yesterday
33.9%
(2022)
Compared to:
Prior Value
(20.6%)
Prior Value compares a measured value with the previously measured value. Confidence intervals were taken into account in determining the direction of the comparison.
PAN Plan Target
(18.7%)
State: Hawaii Children Who Eat Fast Food at Least Once Per Week
State: Hawaii Children Who Eat Fast Food at Least Once Per Week
55.6%
(2022)
Compared to:
Prior Value
(49.7%)
Prior Value compares a measured value with the previously measured value. Confidence intervals were taken into account in determining the direction of the comparison.
PAN Plan Target
(45.2%)
State: Hawaii Farmers Markets that Accept SNAP EBT Transactions
State: Hawaii Farmers Markets that Accept SNAP EBT Transactions
27
Farmers markets
(2016)
Compared to:
Prior Value
(29)
Prior Value compares a measured value with the previously measured value. Confidence intervals were not taken into account in determining the direction of the comparison.
PAN Plan Target
(71)
95.5%
(2016)
Compared to:
US Value
(96.2%)
The regional value is compared to the national median.
Prior Value
(95.4%)
Prior Value compares a measured value with the previously measured value. Confidence intervals were not taken into account in determining the direction of the comparison.
Trend
This comparison measures the indicator’s values over multiple time periods.<br>The Mann-Kendall Test for Statistical Significance is used to evaluate the trend<br>over 4 to 10 periods of measure, subject to data availability and comparability.
1
(2017)
Compared to:
Prior Value
(1)
Prior Value compares a measured value with the previously measured value. Confidence intervals were not taken into account in determining the direction of the comparison.
Trend
This comparison measures the indicator’s values over multiple time periods.<br>The Mann-Kendall Test for Statistical Significance is used to evaluate the trend<br>over 4 to 10 periods of measure, subject to data availability and comparability.
PAN Plan Target
(1)
State: Hawaii Teen Fruit and Vegetable Consumption
State: Hawaii Teen Fruit and Vegetable Consumption
13.8%
(2021)
Compared to:
US Value
(22.3% in 2011)
This distribution is based on the national average from YRBS, which is a national school-based survey of public schools.
Prior Value
(13.9%)
Prior Value compares a measured value with the previously measured value. Confidence intervals were taken into account in determining the direction of the comparison.
Trend
This comparison measures the indicator’s values over multiple time periods.<br>The Mann-Kendall Test for Statistical Significance is used to evaluate the trend<br>over 4 to 10 periods of measure, subject to data availability and comparability.
PAN Plan Target
(15.4%)
10.4%
(2021)
Compared to:
US Value
(14.7%)
The regional value is compared to the national value.
Prior Value
(10.6%)
Prior Value compares a measured value with the previously measured value. Confidence intervals were taken into account in determining the direction of the comparison.
Trend
This comparison measures the indicator’s values over multiple time periods.<br>The Mann-Kendall Test for Statistical Significance is used to evaluate the trend<br>over 4 to 10 periods of measure, subject to data availability and comparability.
PAN Plan Target
(9.4%)
29.6%
(2019)
Compared to:
Prior Value
(30.0%)
Prior Value compares a measured value with the previously measured value. Confidence intervals were not taken into account in determining the direction of the comparison.
PAN Plan Target
(26.3%)
10.7%
(2019)
Compared to:
Prior Value
(10.2%)
Prior Value compares a measured value with the previously measured value. Confidence intervals were taken into account in determining the direction of the comparison.
PAN Plan Target
(9.5%)
State: Hawaii
Health / Older Adults
Value
Compared to:
State: Hawaii Adult Day Care Spending-to-Income Ratio
State: Hawaii Adult Day Care Spending-to-Income Ratio
13.8%
(2023)
Compared to:

U.S. States
The distribution is based on data from 50 U.S. states and the District of Columbia.
Prior Value
(13.7%)
Prior Value compares a measured value with the previously measured value. Confidence intervals were not taken into account in determining the direction of the comparison.
53.0%
(2020)
Compared to:
Prior Value
(42.8%)
Prior Value compares a measured value with the previously measured value. Confidence intervals were taken into account in determining the direction of the comparison.
Trend
This comparison measures the indicator’s values over multiple time periods.<br>The Mann-Kendall Test for Statistical Significance is used to evaluate the trend<br>over 4 to 10 periods of measure, subject to data availability and comparability.
58.3%
(2020)
Compared to:
Prior Value
(40.8%)
Prior Value compares a measured value with the previously measured value. Confidence intervals were taken into account in determining the direction of the comparison.
Trend
This comparison measures the indicator’s values over multiple time periods.<br>The Mann-Kendall Test for Statistical Significance is used to evaluate the trend<br>over 4 to 10 periods of measure, subject to data availability and comparability.
State: Hawaii Adults 65+ with a Disability
State: Hawaii Adults 65+ with a Disability
32.5%
(2018-2022)
Compared to:
US Value
(33.3%)
The regional value is compared to the national value.
Trend
This comparison measures the indicator’s values over multiple time periods.<br>The Mann-Kendall Test for Statistical Significance is used to evaluate the trend<br>over 4 to 10 periods of measure, subject to data availability and comparability.
State: Hawaii Adults 65+ with a Hearing Difficulty
State: Hawaii Adults 65+ with a Hearing Difficulty
13.7%
(2018-2022)
Compared to:
US Value
(13.7%)
The regional value is compared to the national value.
Trend
This comparison measures the indicator’s values over multiple time periods.<br>The Mann-Kendall Test for Statistical Significance is used to evaluate the trend<br>over 4 to 10 periods of measure, subject to data availability and comparability.
State: Hawaii Adults 65+ with a Self-Care Difficulty
State: Hawaii Adults 65+ with a Self-Care Difficulty
7.4%
(2018-2022)
Compared to:
US Value
(7.4%)
The regional value is compared to the national value.
Trend
This comparison measures the indicator’s values over multiple time periods.<br>The Mann-Kendall Test for Statistical Significance is used to evaluate the trend<br>over 4 to 10 periods of measure, subject to data availability and comparability.
State: Hawaii Adults 65+ with a Vision Difficulty
State: Hawaii Adults 65+ with a Vision Difficulty
4.9%
(2018-2022)
Compared to:
US Value
(6.0%)
The regional value is compared to the national value.
Trend
This comparison measures the indicator’s values over multiple time periods.<br>The Mann-Kendall Test for Statistical Significance is used to evaluate the trend<br>over 4 to 10 periods of measure, subject to data availability and comparability.
State: Hawaii Adults 65+ with an Independent Living Difficulty
State: Hawaii Adults 65+ with an Independent Living Difficulty
15.6%
(2018-2022)
Compared to:

US Value
(13.6%)
The regional value is compared to the national value.
Trend
This comparison measures the indicator’s values over multiple time periods.<br>The Mann-Kendall Test for Statistical Significance is used to evaluate the trend<br>over 4 to 10 periods of measure, subject to data availability and comparability.
State: Hawaii Alzheimer's Disease or Dementia: Medicare Population
State: Hawaii Alzheimer's Disease or Dementia: Medicare Population
7.0%
(2022)
Compared to:
U.S. States
The distribution is based on data from 50 U.S. states and the District of Columbia.
US Value
(6.0%)
The regional value is compared to the national value.
Prior Value
(7.0%)
Prior Value compares a measured value with the previously measured value. Confidence intervals were not taken into account in determining the direction of the comparison.
Trend
This comparison measures the indicator’s values over multiple time periods.<br>The Mann-Kendall Test for Statistical Significance is used to evaluate the trend<br>over 4 to 10 periods of measure, subject to data availability and comparability.
State: Hawaii Fall-Related ED Visit Rate, Adults 65+
State: Hawaii Fall-Related ED Visit Rate, Adults 65+
3,643.4
Visits per 100,000 population 65+
(2019)
Compared to:
Prior Value
(3,513.5)
Prior Value compares a measured value with the previously measured value. Confidence intervals were not taken into account in determining the direction of the comparison.
Trend
This comparison measures the indicator’s values over multiple time periods.<br>The Mann-Kendall Test for Statistical Significance is used to evaluate the trend<br>over 4 to 10 periods of measure, subject to data availability and comparability.
State: Hawaii Fall-Related Hospitalization Rate, Adults 65+
State: Hawaii Fall-Related Hospitalization Rate, Adults 65+
710.2
Hospitalizations per 100,000 population 65+
(2019)
Compared to:
Prior Value
(717.8)
Prior Value compares a measured value with the previously measured value. Confidence intervals were not taken into account in determining the direction of the comparison.
Trend
This comparison measures the indicator’s values over multiple time periods.<br>The Mann-Kendall Test for Statistical Significance is used to evaluate the trend<br>over 4 to 10 periods of measure, subject to data availability and comparability.
State: Hawaii
Health / Oral Health
Value
Compared to:
State: Hawaii Adult Oral Health ED Visits
State: Hawaii Adult Oral Health ED Visits
379.8
Visits per 100,000 population 21+ yrs
(2019)
Compared to:
Prior Value
(383.7)
Prior Value compares a measured value with the previously measured value. Confidence intervals were not taken into account in determining the direction of the comparison.
Trend
This comparison measures the indicator’s values over multiple time periods.<br>The Mann-Kendall Test for Statistical Significance is used to evaluate the trend<br>over 4 to 10 periods of measure, subject to data availability and comparability.
State: Hawaii Adult Oral Health-Related ED Visits
State: Hawaii Adult Oral Health-Related ED Visits
560.1
Visits per 100,000 population 21+ yrs
(2019)
Compared to:
Prior Value
(571.7)
Prior Value compares a measured value with the previously measured value. Confidence intervals were not taken into account in determining the direction of the comparison.
Trend
This comparison measures the indicator’s values over multiple time periods.<br>The Mann-Kendall Test for Statistical Significance is used to evaluate the trend<br>over 4 to 10 periods of measure, subject to data availability and comparability.
State: Hawaii Adults 45+ with Total Tooth Loss
State: Hawaii Adults 45+ with Total Tooth Loss
3.6%
(2022)
Compared to:
Prior Value
(3.3%)
Prior Value compares a measured value with the previously measured value. Confidence intervals were taken into account in determining the direction of the comparison.
Trend
This comparison measures the indicator’s values over multiple time periods.<br>The Mann-Kendall Test for Statistical Significance is used to evaluate the trend<br>over 4 to 10 periods of measure, subject to data availability and comparability.
HP 2030 Target
(5.4%)
<div><span>OH-05: Reduce the proportion of adults aged 45 years and over who have lost all their teeth. <br /><br />The national indicator defined exactly the same way. The data source for the national indicator is based on the National Health and Nutrition Examination Survey (NHANES) which is based on a physical exam and from which data for Hawaii cannot be obtained. The state data for this objective is the Behavioral Risk Factor Surveillance System, which is comparable to the national data source.</span></div>
State: Hawaii Adults 65+ with Total Tooth Loss
State: Hawaii Adults 65+ with Total Tooth Loss
5.4%
(2022)
Compared to:
Median Value for States and Territories
(11.8%)
The regional value is compared to the median value for states and territories.
Prior Value
(5.6%)
Prior Value compares a measured value with the previously measured value. Confidence intervals were taken into account in determining the direction of the comparison.
Trend
This comparison measures the indicator’s values over multiple time periods.<br>The Mann-Kendall Test for Statistical Significance is used to evaluate the trend<br>over 4 to 10 periods of measure, subject to data availability and comparability.
State: Hawaii Adults Transported by Medicaid for Dental Services
State: Hawaii Adults Transported by Medicaid for Dental Services
36
Adults
(2021)
Compared to:
Prior Value
(14)
Prior Value compares a measured value with the previously measured value. Confidence intervals were not taken into account in determining the direction of the comparison.
Trend
This comparison measures the indicator’s values over multiple time periods.<br>The Mann-Kendall Test for Statistical Significance is used to evaluate the trend<br>over 4 to 10 periods of measure, subject to data availability and comparability.
State: Hawaii Adults Who Visited a Dentist
State: Hawaii Adults Who Visited a Dentist
71.9%
(2022)
Compared to:
Median Value for States and Territories
(65.2%)
The regional value is compared to the median value for states and territories.
Prior Value
(74.7%)
Prior Value compares a measured value with the previously measured value. Confidence intervals were taken into account in determining the direction of the comparison.
Trend
This comparison measures the indicator’s values over multiple time periods.<br>The Mann-Kendall Test for Statistical Significance is used to evaluate the trend<br>over 4 to 10 periods of measure, subject to data availability and comparability.
HP 2030 LHI
(45.0%)
<div><span>OH-08: Increase use of the oral health care system <strong>(LEADING HEALTH INDICATOR)</strong><br /><br />The national indicator includes persons of all ages. The data source for the national indicator is the Medical Expenditue Panel Survey, from which state-level data for Hawaii cannot be estimated. The state data sources include the National Survey on Children's Health for children aged 1-17, the Youth Risk Behavior Survey for middle school (young teens) and high school students (teens), and the Behavioral Risk Factor Surveillance System for adults aged 18 and over.</span></div>
State: Hawaii Adults with No Recent Dental Visit
State: Hawaii Adults with No Recent Dental Visit
28.1%
(2022)
Compared to:
Median Value for States and Territories
(34.8%)
The regional value is compared to the median value for states and territories.
Prior Value
(25.3%)
Prior Value compares a measured value with the previously measured value. Confidence intervals were taken into account in determining the direction of the comparison.
Trend
This comparison measures the indicator’s values over multiple time periods.<br>The Mann-Kendall Test for Statistical Significance is used to evaluate the trend<br>over 4 to 10 periods of measure, subject to data availability and comparability.
State: Hawaii Adults with One or More Tooth Extractions
State: Hawaii Adults with One or More Tooth Extractions
38.2%
(2022)
Compared to:
Median Value for States and Territories
(41.4%)
The regional value is compared to the median value for states and territories.
Prior Value
(39.8%)
Prior Value compares a measured value with the previously measured value. Confidence intervals were taken into account in determining the direction of the comparison.
Trend
This comparison measures the indicator’s values over multiple time periods.<br>The Mann-Kendall Test for Statistical Significance is used to evaluate the trend<br>over 4 to 10 periods of measure, subject to data availability and comparability.
State: Hawaii Adults with Substantial Tooth Loss
State: Hawaii Adults with Substantial Tooth Loss
8.0%
Percent (%)
(2022)
Compared to:
Prior Value
(8.4%)
Prior Value compares a measured value with the previously measured value. Confidence intervals were taken into account in determining the direction of the comparison.
Trend
This comparison measures the indicator’s values over multiple time periods.<br>The Mann-Kendall Test for Statistical Significance is used to evaluate the trend<br>over 4 to 10 periods of measure, subject to data availability and comparability.
State: Hawaii Children Transported by Medicaid for Dental Services
State: Hawaii Children Transported by Medicaid for Dental Services
256
Children
(2021)
Compared to:
Prior Value
(142)
Prior Value compares a measured value with the previously measured value. Confidence intervals were not taken into account in determining the direction of the comparison.
Trend
This comparison measures the indicator’s values over multiple time periods.<br>The Mann-Kendall Test for Statistical Significance is used to evaluate the trend<br>over 4 to 10 periods of measure, subject to data availability and comparability.
State: Hawaii Children Who Visited a Dentist in the Past Year
State: Hawaii Children Who Visited a Dentist in the Past Year
87.7%
(2020-2021)
Compared to:
US Value
(78.6%)
The regional value is compared to the national value.
Prior Value
(86.7%)
Prior Value compares a measured value with the previously measured value. Confidence intervals were taken into account in determining the direction of the comparison.
Trend
This comparison measures the indicator’s values over multiple time periods.<br>The Mann-Kendall Test for Statistical Significance is used to evaluate the trend<br>over 4 to 10 periods of measure, subject to data availability and comparability.
HP 2030 LHI
(45.0%)
<div><span>OH-08: Increase use of the oral health care system <strong>(LEADING HEALTH INDICATOR)</strong><br /><br />The national indicator includes persons of all ages. The data source for the national indicator is the Medical Expenditue Panel Survey, from which state-level data for Hawaii cannot be estimated. The state data sources include the National Survey on Children's Health for children aged 1-17, the Youth Risk Behavior Survey for middle school (young teens) and high school students (teens), and the Behavioral Risk Factor Surveillance System for adults aged 18 and over.</span></div>
State: Hawaii Children with a Preventive Dental Care Visit
State: Hawaii Children with a Preventive Dental Care Visit
84.9%
(2020-2021)
Compared to:
US Value
(75.1%)
The regional value is compared to the national value.
Prior Value
(85.6%)
Prior Value compares a measured value with the previously measured value. Confidence intervals were taken into account in determining the direction of the comparison.
Trend
This comparison measures the indicator’s values over multiple time periods.<br>The Mann-Kendall Test for Statistical Significance is used to evaluate the trend<br>over 4 to 10 periods of measure, subject to data availability and comparability.
HP 2030 Target
(79.9%)
<div>OH-09: Increase the proportion of low-income youth who have a preventive dental visit.</div>
<div> </div>
<div>The national indicator is limited to youth who reside in households with income less than 200 percent of the federal poverty level. <span style="font-weight:400;">The data source for the national indicator is the same as for the state. To see the exact comparison view by percent of Federal Poverty Level subgroup 0-199%.</span></div>
<div> </div>
<div> </div>
State: Hawaii Children with Cavities or Tooth Decay
State: Hawaii Children with Cavities or Tooth Decay
10.6%
(2020-2021)
Compared to:
US Value
(12.2%)
The regional value is compared to the national value.
Prior Value
(14.1%)
Prior Value compares a measured value with the previously measured value. Confidence intervals were taken into account in determining the direction of the comparison.
Trend
This comparison measures the indicator’s values over multiple time periods.<br>The Mann-Kendall Test for Statistical Significance is used to evaluate the trend<br>over 4 to 10 periods of measure, subject to data availability and comparability.
HP 2030 Target
(10.2%)
<div>OH-2: Reduce the proportion of children and adolescents with active and untreated tooth decay.</div>
<div> </div>
<div>The national indicator includes youth aged 3-19 years. <span style="font-weight:400;">The data source for the national indicator is the National Health and Nutrition Examination Survey, which is not conducted in Hawaii. The state data source is the National Survey of Children's Health, which is comparable to the national data source.</span></div>
State: Hawaii Children with Oral Health Problems
State: Hawaii Children with Oral Health Problems
12.3%
(2020-2021)
Compared to:
US Value
(14.5%)
The regional value is compared to the national value.
Prior Value
(16.5%)
Prior Value compares a measured value with the previously measured value. Confidence intervals were taken into account in determining the direction of the comparison.
Trend
This comparison measures the indicator’s values over multiple time periods.<br>The Mann-Kendall Test for Statistical Significance is used to evaluate the trend<br>over 4 to 10 periods of measure, subject to data availability and comparability.
State: Hawaii Children with Poor or Fair Teeth
State: Hawaii Children with Poor or Fair Teeth
4.0%
(2020-2021)
Compared to:
US Value
(5.9%)
The regional value is compared to the national value.
Prior Value
(4.0%)
Prior Value compares a measured value with the previously measured value. Confidence intervals were taken into account in determining the direction of the comparison.
Trend
This comparison measures the indicator’s values over multiple time periods.<br>The Mann-Kendall Test for Statistical Significance is used to evaluate the trend<br>over 4 to 10 periods of measure, subject to data availability and comparability.
State: Hawaii Dentist Rate
State: Hawaii Dentist Rate
90
Dentists per 100,000 population
(2022)
Compared to:
U.S. States
The distribution is based on data from 50 U.S. states and the District of Columbia.
Prior Value
(88)
Prior Value compares a measured value with the previously measured value. Confidence intervals were not taken into account in determining the direction of the comparison.
Trend
This comparison measures the indicator’s values over multiple time periods.<br>The Mann-Kendall Test for Statistical Significance is used to evaluate the trend<br>over 4 to 10 periods of measure, subject to data availability and comparability.
25.8%
(2019)
Compared to:
Prior Value
(25.1%)
Prior Value compares a measured value with the previously measured value. Confidence intervals were not taken into account in determining the direction of the comparison.
32.6%
(2019)
Compared to:
Prior Value
(31.5%)
Prior Value compares a measured value with the previously measured value. Confidence intervals were not taken into account in determining the direction of the comparison.
48.0%
(2019)
Compared to:
Prior Value
(47.2%)
Prior Value compares a measured value with the previously measured value. Confidence intervals were not taken into account in determining the direction of the comparison.
10.7%
(2019)
Compared to:
Prior Value
(10.6%)
Prior Value compares a measured value with the previously measured value. Confidence intervals were not taken into account in determining the direction of the comparison.
State: Hawaii EPSDT Children 6-9 Who Received Any Dental Services
State: Hawaii EPSDT Children 6-9 Who Received Any Dental Services
71.3%
(2019)
Compared to:
Prior Value
(70.0%)
Prior Value compares a measured value with the previously measured value. Confidence intervals were not taken into account in determining the direction of the comparison.
State: Hawaii Head Start Children Who Needed Oral Health Treatment
State: Hawaii Head Start Children Who Needed Oral Health Treatment
11.0%
(2021)
Compared to:
US Value
(15.6%)
The regional value is compared to the national value.
Prior Value
(17.3%)
Prior Value compares a measured value with the previously measured value. Confidence intervals were not taken into account in determining the direction of the comparison.
Trend
This comparison measures the indicator’s values over multiple time periods.<br>The Mann-Kendall Test for Statistical Significance is used to evaluate the trend<br>over 4 to 10 periods of measure, subject to data availability and comparability.
State: Hawaii Head Start Children Who Received a Dental Exam
State: Hawaii Head Start Children Who Received a Dental Exam
52.3%
(2021)
Compared to:
US Value
(55.6%)
The regional value is compared to the national value.
Prior Value
(84.1%)
Prior Value compares a measured value with the previously measured value. Confidence intervals were not taken into account in determining the direction of the comparison.
Trend
This comparison measures the indicator’s values over multiple time periods.<br>The Mann-Kendall Test for Statistical Significance is used to evaluate the trend<br>over 4 to 10 periods of measure, subject to data availability and comparability.
State: Hawaii Head Start Children Who Received Oral Health Treatment
State: Hawaii Head Start Children Who Received Oral Health Treatment
70.2%
(2021)
Compared to:
US Value
(63.3%)
The regional value is compared to the national value.
Prior Value
(83.7%)
Prior Value compares a measured value with the previously measured value. Confidence intervals were not taken into account in determining the direction of the comparison.
Trend
This comparison measures the indicator’s values over multiple time periods.<br>The Mann-Kendall Test for Statistical Significance is used to evaluate the trend<br>over 4 to 10 periods of measure, subject to data availability and comparability.
State: Hawaii Medicaid Enrolled Dentists
State: Hawaii Medicaid Enrolled Dentists
798
(2022)
Compared to:
Prior Value
(794)
Prior Value compares a measured value with the previously measured value. Confidence intervals were not taken into account in determining the direction of the comparison.
Trend
This comparison measures the indicator’s values over multiple time periods.<br>The Mann-Kendall Test for Statistical Significance is used to evaluate the trend<br>over 4 to 10 periods of measure, subject to data availability and comparability.
State: Hawaii Medicaid Enrolled Dentists with 1 or More Claims
State: Hawaii Medicaid Enrolled Dentists with 1 or More Claims
401
Dentists
(2021)
Compared to:
Prior Value
(429)
Prior Value compares a measured value with the previously measured value. Confidence intervals were not taken into account in determining the direction of the comparison.
Trend
This comparison measures the indicator’s values over multiple time periods.<br>The Mann-Kendall Test for Statistical Significance is used to evaluate the trend<br>over 4 to 10 periods of measure, subject to data availability and comparability.
State: Hawaii Medicaid Enrolled Dentists with 50 or More Claims
State: Hawaii Medicaid Enrolled Dentists with 50 or More Claims
283
Dentists
(2021)
Compared to:
Prior Value
(276)
Prior Value compares a measured value with the previously measured value. Confidence intervals were not taken into account in determining the direction of the comparison.
Trend
This comparison measures the indicator’s values over multiple time periods.<br>The Mann-Kendall Test for Statistical Significance is used to evaluate the trend<br>over 4 to 10 periods of measure, subject to data availability and comparability.
State: Hawaii Pregnant Women Who Talked with a Dentist
State: Hawaii Pregnant Women Who Talked with a Dentist
46.6%
(2021)
Compared to:
Prior Value
(48.3%)
Prior Value compares a measured value with the previously measured value. Confidence intervals were taken into account in determining the direction of the comparison.
Trend
This comparison measures the indicator’s values over multiple time periods.<br>The Mann-Kendall Test for Statistical Significance is used to evaluate the trend<br>over 4 to 10 periods of measure, subject to data availability and comparability.
State: Hawaii Pregnant Women with Dental Insurance
State: Hawaii Pregnant Women with Dental Insurance
81.5%
(2021)
Compared to:
Prior Value
(81.3%)
Prior Value compares a measured value with the previously measured value. Confidence intervals were taken into account in determining the direction of the comparison.
Trend
This comparison measures the indicator’s values over multiple time periods.<br>The Mann-Kendall Test for Statistical Significance is used to evaluate the trend<br>over 4 to 10 periods of measure, subject to data availability and comparability.
HP 2030 Target
(75.0%)
<div><span>AHS-02: Increase the proportion of people with dental insurance </span></div>
<div><span></span></div>
<div><span>The national indicator is defined in exactly the same way. The data source for the national indicator is the National Health Interview Survey, from which state-level data for Hawaii cannot be obtained. The state data source is the Pregnancy Risk Assessment Monitoring Survey.</span></div>
50.7%
(2021)
Compared to:
Prior Value
(57.2%)
Prior Value compares a measured value with the previously measured value. Confidence intervals were not taken into account in determining the direction of the comparison.
Trend
This comparison measures the indicator’s values over multiple time periods.<br>The Mann-Kendall Test for Statistical Significance is used to evaluate the trend<br>over 4 to 10 periods of measure, subject to data availability and comparability.
35.8%
(2021)
Compared to:
Prior Value
(36.8%)
Prior Value compares a measured value with the previously measured value. Confidence intervals were not taken into account in determining the direction of the comparison.
Trend
This comparison measures the indicator’s values over multiple time periods.<br>The Mann-Kendall Test for Statistical Significance is used to evaluate the trend<br>over 4 to 10 periods of measure, subject to data availability and comparability.
State: Hawaii Teens Who Saw a Dentist in the Past Year
State: Hawaii Teens Who Saw a Dentist in the Past Year
79.5%
(2021)
Compared to:
US Value
(75.9% in 2019)
The regional value is compared to the national value.
Prior Value
(80.2%)
Prior Value compares a measured value with the previously measured value. Confidence intervals were taken into account in determining the direction of the comparison.
Trend
This comparison measures the indicator’s values over multiple time periods.<br>The Mann-Kendall Test for Statistical Significance is used to evaluate the trend<br>over 4 to 10 periods of measure, subject to data availability and comparability.
HP 2030 LHI
(45.0%)
<div><span>OH-08: Increase use of the oral health care system <strong>(LEADING HEALTH INDICATOR)</strong><br /><br />The national indicator includes persons of all ages. The data source for the national indicator is the Medical Expenditue Panel Survey, from which state-level data for Hawaii cannot be estimated. The state data sources include the National Survey on Children's Health for children aged 1-17, the Youth Risk Behavior Survey for middle school (young teens) and high school students (teens), and the Behavioral Risk Factor Surveillance System for adults aged 18 and over.</span></div>
State: Hawaii Women Who Had Their Teeth Cleaned During Pregnancy
State: Hawaii Women Who Had Their Teeth Cleaned During Pregnancy
44.6%
(2021)
Compared to:
US Value
(40.0% in 2020)
The regional value is compared to the national value.
Prior Value
(42.4%)
Prior Value compares a measured value with the previously measured value. Confidence intervals were taken into account in determining the direction of the comparison.
Trend
This comparison measures the indicator’s values over multiple time periods.<br>The Mann-Kendall Test for Statistical Significance is used to evaluate the trend<br>over 4 to 10 periods of measure, subject to data availability and comparability.
State: Hawaii Women Who Had Their Teeth Cleaned PRAMS
State: Hawaii Women Who Had Their Teeth Cleaned PRAMS
81.2%
(2021)
Compared to:
Prior Value
(80.9%)
Prior Value compares a measured value with the previously measured value. Confidence intervals were taken into account in determining the direction of the comparison.
Trend
This comparison measures the indicator’s values over multiple time periods.<br>The Mann-Kendall Test for Statistical Significance is used to evaluate the trend<br>over 4 to 10 periods of measure, subject to data availability and comparability.
88.4%
(2021)
Compared to:
Prior Value
(88.7%)
Prior Value compares a measured value with the previously measured value. Confidence intervals were taken into account in determining the direction of the comparison.
Trend
This comparison measures the indicator’s values over multiple time periods.<br>The Mann-Kendall Test for Statistical Significance is used to evaluate the trend<br>over 4 to 10 periods of measure, subject to data availability and comparability.
State: Hawaii Women Who Needed a Dentist During Pregnancy
State: Hawaii Women Who Needed a Dentist During Pregnancy
84.9%
(2021)
Compared to:
Prior Value
(84.0%)
Prior Value compares a measured value with the previously measured value. Confidence intervals were taken into account in determining the direction of the comparison.
Trend
This comparison measures the indicator’s values over multiple time periods.<br>The Mann-Kendall Test for Statistical Significance is used to evaluate the trend<br>over 4 to 10 periods of measure, subject to data availability and comparability.
11.4%
(2021)
Compared to:
Prior Value
(13.6%)
Prior Value compares a measured value with the previously measured value. Confidence intervals were taken into account in determining the direction of the comparison.
Trend
This comparison measures the indicator’s values over multiple time periods.<br>The Mann-Kendall Test for Statistical Significance is used to evaluate the trend<br>over 4 to 10 periods of measure, subject to data availability and comparability.
State: Hawaii Women with Any Dental Visit During Pregnancy
State: Hawaii Women with Any Dental Visit During Pregnancy
47.4%
(2021)
Compared to:
Prior Value
(47.3%)
Prior Value compares a measured value with the previously measured value. Confidence intervals were taken into account in determining the direction of the comparison.
Trend
This comparison measures the indicator’s values over multiple time periods.<br>The Mann-Kendall Test for Statistical Significance is used to evaluate the trend<br>over 4 to 10 periods of measure, subject to data availability and comparability.
State: Hawaii Young Teens Who Saw a Dentist in the Past Year
State: Hawaii Young Teens Who Saw a Dentist in the Past Year
78.2%
(2021)
Compared to:
Prior Value
(80.5%)
Prior Value compares a measured value with the previously measured value. Confidence intervals were taken into account in determining the direction of the comparison.
Trend
This comparison measures the indicator’s values over multiple time periods.<br>The Mann-Kendall Test for Statistical Significance is used to evaluate the trend<br>over 4 to 10 periods of measure, subject to data availability and comparability.
HP 2030 LHI
(45.0%)
<div><span>OH-08: Increase use of the oral health care system <strong>(LEADING HEALTH INDICATOR)</strong><br /><br />The national indicator includes persons of all ages. The data source for the national indicator is the Medical Expenditue Panel Survey, from which state-level data for Hawaii cannot be estimated. The state data sources include the National Survey on Children's Health for children aged 1-17, the Youth Risk Behavior Survey for middle school (young teens) and high school students (teens), and the Behavioral Risk Factor Surveillance System for adults aged 18 and over.</span></div>
State: Hawaii
Health / Other Conditions
Value
Compared to:
State: Hawaii Adults Who Visited a Dermatologist
State: Hawaii Adults Who Visited a Dermatologist
19.6%
(2023)
Compared to:
US Value
(15.9%)
The regional value is compared to the national value.
Prior Value
(17.6%)
Prior Value compares a measured value with the previously measured value. Confidence intervals were not taken into account in determining the direction of the comparison.
Trend
This comparison measures the indicator’s values over multiple time periods.<br>The Mann-Kendall Test for Statistical Significance is used to evaluate the trend<br>over 4 to 10 periods of measure, subject to data availability and comparability.
State: Hawaii Adults with Arthritis
State: Hawaii Adults with Arthritis
22.9%
(2022)
Compared to:
Median Value for States and Territories
(27.1%)
The regional value is compared to the median value for states and territories.
Prior Value
(20.4%)
Prior Value compares a measured value with the previously measured value. Confidence intervals were taken into account in determining the direction of the comparison.
Trend
This comparison measures the indicator’s values over multiple time periods.<br>The Mann-Kendall Test for Statistical Significance is used to evaluate the trend<br>over 4 to 10 periods of measure, subject to data availability and comparability.
State: Hawaii Adults with CKD Who Have High Blood Pressure
State: Hawaii Adults with CKD Who Have High Blood Pressure
68.3%
(2019, 2021)
Compared to:
Prior Value
(68.1%)
Prior Value compares a measured value with the previously measured value. Confidence intervals were taken into account in determining the direction of the comparison.
Trend
This comparison measures the indicator’s values over multiple time periods.<br>The Mann-Kendall Test for Statistical Significance is used to evaluate the trend<br>over 4 to 10 periods of measure, subject to data availability and comparability.
HP 2030 Target
(42.8%)
<div><span>CKD-06: Reduce the proportion of adults with chronic kidney disease who have elevated blood pressure<br /><br />The data source for the national indicator is the National Health and Nutrition Examination Survey, from which state-level data for Hawaii cannot be obtained. The state data source is the Behavioral Risk Factor Surveillance System, which is comparable to the national data source. </span></div>
State: Hawaii Adults with Kidney Disease
State: Hawaii Adults with Kidney Disease
3.4%
(2022)
Compared to:
Median Value for States and Territories
(3.5%)
The regional value is compared to the median value for states and territories.
Prior Value
(2.8%)
Prior Value compares a measured value with the previously measured value. Confidence intervals were taken into account in determining the direction of the comparison.
Trend
This comparison measures the indicator’s values over multiple time periods.<br>The Mann-Kendall Test for Statistical Significance is used to evaluate the trend<br>over 4 to 10 periods of measure, subject to data availability and comparability.
HP 2030 Target
(12.8%)
<div>
<div>CKD-01: Reduce the proportion of adults with chronic kidney disease.</div>
<div> </div>
<div>The national indicator is defined differently as it is based on age-adjusted laboratory values. The data source for the national indicator is the National Health and Nutrition Examination Survey, which is not conducted in Hawaii. The state data source is the Behavioral Risk Factor Surveillance System, which is self-reported but comparable to the national data source.</div>
</div>
State: Hawaii Adults With Two or More Chronic Conditions
State: Hawaii Adults With Two or More Chronic Conditions
35.8%
(2021)
Compared to:
Prior Value
(36.6%)
Prior Value compares a measured value with the previously measured value. Confidence intervals were taken into account in determining the direction of the comparison.
Trend
This comparison measures the indicator’s values over multiple time periods.<br>The Mann-Kendall Test for Statistical Significance is used to evaluate the trend<br>over 4 to 10 periods of measure, subject to data availability and comparability.
State: Hawaii Chronic Kidney Disease: Medicare Population
State: Hawaii Chronic Kidney Disease: Medicare Population
25.0%
(2022)
Compared to:

U.S. States
The distribution is based on data from 50 U.S. states and the District of Columbia.
US Value
(18.0%)
The regional value is compared to the national value.
Prior Value
(24.0%)
Prior Value compares a measured value with the previously measured value. Confidence intervals were not taken into account in determining the direction of the comparison.
Trend
This comparison measures the indicator’s values over multiple time periods.<br>The Mann-Kendall Test for Statistical Significance is used to evaluate the trend<br>over 4 to 10 periods of measure, subject to data availability and comparability.
