
Advanced Search: Build a Custom Dashboard
In the fields below, search for indicators by location, topics, population, classification, subgroup, or comparison. No fields are required, but we suggest selecting a location or two to start. In the additional search options section, select options to group and order search results. To learn more about how to customize a dashboard, see our help center.
Visit the Indicator List Page to see the full list of indicators and locations available on the site.
Search Results:
Indicator Gauge Icon Legend
Legend Colors
Red is bad, green is good, blue is not statistically different/neutral.
Compared to Distribution
 the value is in the best half of communities.
 the value is in the 2nd worst quarter of communities.
 the value is in the worst quarter of communities.
Compared to Target
 meets target;
  does not meet target.
Compared to a Single Value
 lower than the comparison value;
 higher than the comparison value;
 not statistically different from comparison value.
Trend

 non-significant change over time;
 significant change over time;
  no change over time.
Compared to Prior Value
 higher than the previous measurement period;
 lower than the previous measurement period;
 no statistically different change from previous measurement period.
Economy / Poverty
Economy / Poverty
County: Maui
Value
Compared to:
County: Maui Adults with Disability Living in Poverty
County: Maui Adults with Disability Living in Poverty
23.5%
(2018-2022)
Compared to:
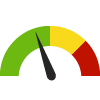


U.S. Counties
The distribution is based on data from 3,132 U.S. counties and county equivalents.
HI Value
(19.9%)
The regional value is compared to the Hawaii State value.
US Value
(24.9%)
The regional value is compared to the national value.
Trend
This comparison measures the indicator’s values over multiple time periods.<br>The Mann-Kendall Test for Statistical Significance is used to evaluate the trend<br>over 4 to 10 periods of measure, subject to data availability and comparability.
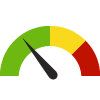
County: Maui Child Food Insecurity Rate
County: Maui Child Food Insecurity Rate
15.5%
(2021)
Compared to:
U.S. Counties
The distribution is based on data from 3,140 U.S. counties and county equivalents.
HI Value
(17.8%)
The regional value is compared to the Hawaii State value.
US Value
(12.8%)
The regional value is compared to the national value.
Prior Value
(27.2%)
Prior Value compares a measured value with the previously measured value. Confidence intervals were not taken into account in determining the direction of the comparison.
Trend
This comparison measures the indicator’s values over multiple time periods.<br>The Mann-Kendall Test for Statistical Significance is used to evaluate the trend<br>over 4 to 10 periods of measure, subject to data availability and comparability.
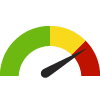
County: Maui Children Living Below 200% of Poverty Level
County: Maui Children Living Below 200% of Poverty Level
29.2%
(2022)
Compared to:
U.S. Counties
The distribution is based on data from 828 U.S. counties and county equivalents.
HI Value
(29.9%)
The regional value is compared to the Hawaii State value.
US Value
(36.5%)
The regional value is compared to the national value.
Prior Value
(30.0%)
Prior Value compares a measured value with the previously measured value. Confidence intervals were not taken into account in determining the direction of the comparison.
Trend
This comparison measures the indicator’s values over multiple time periods.<br>The Mann-Kendall Test for Statistical Significance is used to evaluate the trend<br>over 4 to 10 periods of measure, subject to data availability and comparability.
County: Maui Children Living Below Poverty Level
County: Maui Children Living Below Poverty Level
10.9%
(2018-2022)
Compared to:
U.S. Counties
The distribution is based on data from 3,132 U.S. counties and county equivalents.
HI Value
(12.4%)
The regional value is compared to the Hawaii State value.
US Value
(16.7%)
The regional value is compared to the national value.
Trend
This comparison measures the indicator’s values over multiple time periods.<br>The Mann-Kendall Test for Statistical Significance is used to evaluate the trend<br>over 4 to 10 periods of measure, subject to data availability and comparability.
County: Maui Families Living Below 200% of Poverty Level
County: Maui Families Living Below 200% of Poverty Level
18.1%
(2022)
Compared to:

U.S. Counties
The distribution is based on data from 825 U.S. counties and county equivalents.
HI Value
(17.6%)
The regional value is compared to the Hawaii State value.
US Value
(22.5%)
The regional value is compared to the national value.
Prior Value
(20.2%)
Prior Value compares a measured value with the previously measured value. Confidence intervals were not taken into account in determining the direction of the comparison.
Trend
This comparison measures the indicator’s values over multiple time periods.<br>The Mann-Kendall Test for Statistical Significance is used to evaluate the trend<br>over 4 to 10 periods of measure, subject to data availability and comparability.
County: Maui Families Living Below Poverty Level
County: Maui Families Living Below Poverty Level
6.4%
(2018-2022)
Compared to:
U.S. Counties
The distribution is based on data from 3,104 U.S. counties and county equivalents.
HI Value
(6.5%)
The regional value is compared to the Hawaii State value.
US Value
(8.8%)
The regional value is compared to the national value.
Trend
This comparison measures the indicator’s values over multiple time periods.<br>The Mann-Kendall Test for Statistical Significance is used to evaluate the trend<br>over 4 to 10 periods of measure, subject to data availability and comparability.
55%
(2021)
Compared to:

U.S. Counties
The distribution is based on data from 3,134 U.S. counties and county equivalents.
HI Value
(49%)
The regional value is compared to the Hawaii State value.
US Value
(25%)
The regional value is compared to the national value.
Prior Value
(58%)
Prior Value compares a measured value with the previously measured value. Confidence intervals were not taken into account in determining the direction of the comparison.
Trend
This comparison measures the indicator’s values over multiple time periods.<br>The Mann-Kendall Test for Statistical Significance is used to evaluate the trend<br>over 4 to 10 periods of measure, subject to data availability and comparability.
County: Maui Food Insecurity Rate
County: Maui Food Insecurity Rate
10.6%
(2021)
Compared to:
U.S. Counties
The distribution is based on data from 3,140 U.S. counties and county equivalents.
HI Value
(11.9%)
The regional value is compared to the Hawaii State value.
US Value
(10.4%)
The regional value is compared to the national value.
Prior Value
(15.6%)
Prior Value compares a measured value with the previously measured value. Confidence intervals were not taken into account in determining the direction of the comparison.
Trend
This comparison measures the indicator’s values over multiple time periods.<br>The Mann-Kendall Test for Statistical Significance is used to evaluate the trend<br>over 4 to 10 periods of measure, subject to data availability and comparability.
County: Maui Households Living Below Poverty Level
County: Maui Households Living Below Poverty Level
16.0%
(2022)
Compared to:

HI Value
(15.0%)
The regional value is compared to the Hawaii State value.
Prior Value
(11.3%)
Prior Value compares a measured value with the previously measured value. Confidence intervals were not taken into account in determining the direction of the comparison.
Trend
This comparison measures the indicator’s values over multiple time periods.<br>The Mann-Kendall Test for Statistical Significance is used to evaluate the trend<br>over 4 to 10 periods of measure, subject to data availability and comparability.
County: Maui Households Receiving SNAP
County: Maui Households Receiving SNAP
8.9%
(2016-2020)
Compared to:


US Value
(11.4%)
The regional value is compared to the national value.
Prior Value
(9.3%)
Prior Value compares a measured value with the previously measured value. Confidence intervals were taken into account in determining the direction of the comparison.
Trend
This comparison measures the indicator’s values over multiple time periods.<br>The Mann-Kendall Test for Statistical Significance is used to evaluate the trend<br>over 4 to 10 periods of measure, subject to data availability and comparability.
County: Maui Households Receiving SNAP with Children
County: Maui Households Receiving SNAP with Children
53.1%
(2018-2022)
Compared to:


HI Value
(50.0%)
The regional value is compared to the Hawaii State value.
US Value
(47.9%)
The regional value is compared to the national value.
Trend
This comparison measures the indicator’s values over multiple time periods.<br>The Mann-Kendall Test for Statistical Significance is used to evaluate the trend<br>over 4 to 10 periods of measure, subject to data availability and comparability.
County: Maui Households Receiving SNAP with Children (Count)
County: Maui Households Receiving SNAP with Children (Count)
2,642
Households
(2018-2022)
Compared to:
Trend
This comparison measures the indicator’s values over multiple time periods.<br>The Mann-Kendall Test for Statistical Significance is used to evaluate the trend<br>over 4 to 10 periods of measure, subject to data availability and comparability.
48.0%
(2022)
Compared to:


HI Value
(56.0%)
The regional value is compared to the Hawaii State value.
Prior Value
(50.9%)
Prior Value compares a measured value with the previously measured value. Confidence intervals were not taken into account in determining the direction of the comparison.
Trend
This comparison measures the indicator’s values over multiple time periods.<br>The Mann-Kendall Test for Statistical Significance is used to evaluate the trend<br>over 4 to 10 periods of measure, subject to data availability and comparability.
36.0%
(2022)
Compared to:
HI Value
(29.0%)
The regional value is compared to the Hawaii State value.
Prior Value
(37.8%)
Prior Value compares a measured value with the previously measured value. Confidence intervals were not taken into account in determining the direction of the comparison.
Trend
This comparison measures the indicator’s values over multiple time periods.<br>The Mann-Kendall Test for Statistical Significance is used to evaluate the trend<br>over 4 to 10 periods of measure, subject to data availability and comparability.
County: Maui Households with Cash Public Assistance Income
County: Maui Households with Cash Public Assistance Income
3.8%
(2018-2022)
Compared to:
U.S. Counties
The distribution is based on data from 2,923 U.S. counties and county equivalents.
HI Value
(4.0%)
The regional value is compared to the Hawaii State value.
US Value
(2.7%)
The regional value is compared to the national value.
Trend
This comparison measures the indicator’s values over multiple time periods.<br>The Mann-Kendall Test for Statistical Significance is used to evaluate the trend<br>over 4 to 10 periods of measure, subject to data availability and comparability.
County: Maui Households with Children Receiving Assistance
County: Maui Households with Children Receiving Assistance
23.6%
(2014-2018)
Compared to:
HI Value
(25.3%)
The regional value is compared to the Hawaii State value.
US Value
(26.3%)
The regional value is compared to the national value.
Trend
This comparison measures the indicator’s values over multiple time periods.<br>The Mann-Kendall Test for Statistical Significance is used to evaluate the trend<br>over 4 to 10 periods of measure, subject to data availability and comparability.
County: Maui Income Inequality
County: Maui Income Inequality
0.444
(2018-2022)
Compared to:

U.S. Counties
The distribution is based on data from 3,133 U.S. counties and county equivalents.
HI Value
(0.447)
The regional value is compared to the Hawaii State value.
US Value
(0.483)
The regional value is compared to the national value.
Trend
This comparison measures the indicator’s values over multiple time periods.<br>The Mann-Kendall Test for Statistical Significance is used to evaluate the trend<br>over 4 to 10 periods of measure, subject to data availability and comparability.
County: Maui People 65+ Living Below 200% of Poverty Level
County: Maui People 65+ Living Below 200% of Poverty Level
21.0%
(2022)
Compared to:

U.S. Counties
The distribution is based on data from 828 U.S. counties and county equivalents.
HI Value
(20.5%)
The regional value is compared to the Hawaii State value.
US Value
(28.0%)
The regional value is compared to the national value.
Prior Value
(24.7%)
Prior Value compares a measured value with the previously measured value. Confidence intervals were not taken into account in determining the direction of the comparison.
Trend
This comparison measures the indicator’s values over multiple time periods.<br>The Mann-Kendall Test for Statistical Significance is used to evaluate the trend<br>over 4 to 10 periods of measure, subject to data availability and comparability.
County: Maui People 65+ Living Below Poverty Level
County: Maui People 65+ Living Below Poverty Level
7.7%
(2018-2022)
Compared to:
U.S. Counties
The distribution is based on data from 3,133 U.S. counties and county equivalents.
HI Value
(8.2%)
The regional value is compared to the Hawaii State value.
US Value
(10.0%)
The regional value is compared to the national value.
Trend
This comparison measures the indicator’s values over multiple time periods.<br>The Mann-Kendall Test for Statistical Significance is used to evaluate the trend<br>over 4 to 10 periods of measure, subject to data availability and comparability.
County: Maui People 65+ Living Below Poverty Level (Count)
County: Maui People 65+ Living Below Poverty Level (Count)
2,424
People
(2018-2022)
Compared to:
Trend
This comparison measures the indicator’s values over multiple time periods.<br>The Mann-Kendall Test for Statistical Significance is used to evaluate the trend<br>over 4 to 10 periods of measure, subject to data availability and comparability.
County: Maui People Living Below 200% of Poverty Level
County: Maui People Living Below 200% of Poverty Level
21.9%
(2022)
Compared to:
U.S. Counties
The distribution is based on data from 828 U.S. counties and county equivalents.
HI Value
(23.1%)
The regional value is compared to the Hawaii State value.
US Value
(28.4%)
The regional value is compared to the national value.
Prior Value
(25.2%)
Prior Value compares a measured value with the previously measured value. Confidence intervals were not taken into account in determining the direction of the comparison.
Trend
This comparison measures the indicator’s values over multiple time periods.<br>The Mann-Kendall Test for Statistical Significance is used to evaluate the trend<br>over 4 to 10 periods of measure, subject to data availability and comparability.
County: Maui People Living Below Poverty Level
County: Maui People Living Below Poverty Level
9.3%
(2018-2022)
Compared to:
U.S. Counties
The distribution is based on data from 3,133 U.S. counties and county equivalents.
HI Value
(9.6%)
The regional value is compared to the Hawaii State value.
US Value
(12.5%)
The regional value is compared to the national value.
Trend
This comparison measures the indicator’s values over multiple time periods.<br>The Mann-Kendall Test for Statistical Significance is used to evaluate the trend<br>over 4 to 10 periods of measure, subject to data availability and comparability.
HP 2030 Target
(8.0%)
<div>SDOH-01: Reduce the proportion of people living in poverty</div>
County: Maui Projected Child Food Insecurity Rate
County: Maui Projected Child Food Insecurity Rate
29.5%
(2021)
Compared to:
U.S. Counties
The distribution is based on data from 3,142 U.S. counties and county equivalents.
HI Value
(24.6%)
The regional value is compared to the Hawaii State value.
Prior Value
(29.9%)
Prior Value compares a measured value with the previously measured value. Confidence intervals were not taken into account in determining the direction of the comparison.
County: Maui Projected Food Insecurity Rate
County: Maui Projected Food Insecurity Rate
17.8%
(2021)
Compared to:
U.S. Counties
The distribution is based on data from 3,142 U.S. counties and county equivalents.
HI Value
(15.1%)
The regional value is compared to the Hawaii State value.
Prior Value
(17.5%)
Prior Value compares a measured value with the previously measured value. Confidence intervals were not taken into account in determining the direction of the comparison.
County: Maui Students Eligible for the Free Lunch Program
County: Maui Students Eligible for the Free Lunch Program
37.1%
(2022-2023)
Compared to:
U.S. Counties
The distribution is based on data from 2,710 U.S. counties and county equivalents.
HI Value
(36.7%)
The regional value is compared to the Hawaii State value.
US Value
(42.8%)
The regional value is compared to the national value.
Prior Value
(40.7%)
Prior Value compares a measured value with the previously measured value. Confidence intervals were not taken into account in determining the direction of the comparison.
Trend
This comparison measures the indicator’s values over multiple time periods.<br>The Mann-Kendall Test for Statistical Significance is used to evaluate the trend<br>over 4 to 10 periods of measure, subject to data availability and comparability.
County: Maui Youth not in School or Working
County: Maui Youth not in School or Working
2.0%
(2018-2022)
Compared to:
U.S. Counties
The distribution is based on data from 3,130 U.S. counties and county equivalents.
HI Value
(2.7%)
The regional value is compared to the Hawaii State value.
US Value
(1.8%)
The regional value is compared to the national value.
Trend
This comparison measures the indicator’s values over multiple time periods.<br>The Mann-Kendall Test for Statistical Significance is used to evaluate the trend<br>over 4 to 10 periods of measure, subject to data availability and comparability.
