
Advanced Search: Build a Custom Dashboard
In the fields below, search for indicators by location, topics, population, classification, subgroup, or comparison. No fields are required, but we suggest selecting a location or two to start. In the additional search options section, select options to group and order search results. To learn more about how to customize a dashboard, see our help center.
Visit the Indicator List Page to see the full list of indicators and locations available on the site.
Search Results:
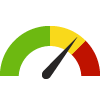
Indicator Gauge Icon Legend
Legend Colors
Red is bad, green is good, blue is not statistically different/neutral.
Compared to Distribution
 the value is in the best half of communities.
 the value is in the 2nd worst quarter of communities.
 the value is in the worst quarter of communities.
Compared to Target
 meets target;
  does not meet target.
Compared to a Single Value
 lower than the comparison value;
 higher than the comparison value;
 not statistically different from comparison value.
Trend

 non-significant change over time;
 significant change over time;
  no change over time.
Compared to Prior Value
 higher than the previous measurement period;
 lower than the previous measurement period;
 no statistically different change from previous measurement period.
Health / Heart Disease & Stroke
Health / Heart Disease & Stroke
County: Honolulu
Value
Compared to:
County: Honolulu Adults Who Bought Medications for Cholesterol
County: Honolulu Adults Who Bought Medications for Cholesterol
17.0%
(2023)
Compared to:


HI Value
(18.3%)
The regional value is compared to the Hawaii State value.
US Value
(17.1%)
The regional value is compared to the national value.
Prior Value
(16.8%)
Prior Value compares a measured value with the previously measured value. Confidence intervals were not taken into account in determining the direction of the comparison.
Trend
This comparison measures the indicator’s values over multiple time periods.<br>The Mann-Kendall Test for Statistical Significance is used to evaluate the trend<br>over 4 to 10 periods of measure, subject to data availability and comparability.
County: Honolulu Adults Who Bought Medications for High Blood Pressure
County: Honolulu Adults Who Bought Medications for High Blood Pressure
22.2%
(2023)
Compared to:

HI Value
(24.5%)
The regional value is compared to the Hawaii State value.
US Value
(24.4%)
The regional value is compared to the national value.
Prior Value
(22.0%)
Prior Value compares a measured value with the previously measured value. Confidence intervals were not taken into account in determining the direction of the comparison.
Trend
This comparison measures the indicator’s values over multiple time periods.<br>The Mann-Kendall Test for Statistical Significance is used to evaluate the trend<br>over 4 to 10 periods of measure, subject to data availability and comparability.
County: Honolulu Adults Who Experienced a Heart Attack
County: Honolulu Adults Who Experienced a Heart Attack
3.5%
(2022)
Compared to:

HI Value
(3.5%)
The regional value is compared to the Hawaii State value.
Median Value for States and Territories
(4.5%)
The regional value is compared to the median value for states and territories.
Prior Value
(2.8%)
Prior Value compares a measured value with the previously measured value. Confidence intervals were taken into account in determining the direction of the comparison.
Trend
This comparison measures the indicator’s values over multiple time periods.<br>The Mann-Kendall Test for Statistical Significance is used to evaluate the trend<br>over 4 to 10 periods of measure, subject to data availability and comparability.
County: Honolulu Adults who Experienced a Stroke
County: Honolulu Adults who Experienced a Stroke
2.4%
(2022)
Compared to:
HI Value
(2.8%)
The regional value is compared to the Hawaii State value.
Median Value for States and Territories
(3.4%)
The regional value is compared to the median value for states and territories.
Prior Value
(3.3%)
Prior Value compares a measured value with the previously measured value. Confidence intervals were taken into account in determining the direction of the comparison.
Trend
This comparison measures the indicator’s values over multiple time periods.<br>The Mann-Kendall Test for Statistical Significance is used to evaluate the trend<br>over 4 to 10 periods of measure, subject to data availability and comparability.
County: Honolulu Adults who Experienced Coronary Heart Disease
County: Honolulu Adults who Experienced Coronary Heart Disease
3.5%
(2022)
Compared to:

HI Value
(3.4%)
The regional value is compared to the Hawaii State value.
Median Value for States and Territories
(4.4%)
The regional value is compared to the median value for states and territories.
Prior Value
(2.4%)
Prior Value compares a measured value with the previously measured value. Confidence intervals were taken into account in determining the direction of the comparison.
Trend
This comparison measures the indicator’s values over multiple time periods.<br>The Mann-Kendall Test for Statistical Significance is used to evaluate the trend<br>over 4 to 10 periods of measure, subject to data availability and comparability.
County: Honolulu Adults who Have Taken Medications for High Blood Pressure
County: Honolulu Adults who Have Taken Medications for High Blood Pressure
79.3%
(2021)
Compared to:


HI Value
(79.5%)
The regional value is compared to the Hawaii State value.
Prior Value
(75.9%)
Prior Value compares a measured value with the previously measured value. Confidence intervals were taken into account in determining the direction of the comparison.
Trend
This comparison measures the indicator’s values over multiple time periods.<br>The Mann-Kendall Test for Statistical Significance is used to evaluate the trend<br>over 4 to 10 periods of measure, subject to data availability and comparability.
HDS Plan Target
(82.6%)
County: Honolulu Adults Who Visited a Cardiologist
County: Honolulu Adults Who Visited a Cardiologist
14.0%
(2023)
Compared to:

HI Value
(14.9%)
The regional value is compared to the Hawaii State value.
US Value
(13.2%)
The regional value is compared to the national value.
Prior Value
(13.1%)
Prior Value compares a measured value with the previously measured value. Confidence intervals were not taken into account in determining the direction of the comparison.
Trend
This comparison measures the indicator’s values over multiple time periods.<br>The Mann-Kendall Test for Statistical Significance is used to evaluate the trend<br>over 4 to 10 periods of measure, subject to data availability and comparability.
County: Honolulu Adults with a Cholesterol Test, past 5 years
County: Honolulu Adults with a Cholesterol Test, past 5 years
83.4%
(2021)
Compared to:
HI Value
(82.7%)
The regional value is compared to the Hawaii State value.
Median Value for States and Territories
(85.3%)
The regional value is compared to the median value for states and territories.
Prior Value
(86.2%)
Prior Value compares a measured value with the previously measured value. Confidence intervals were taken into account in determining the direction of the comparison.
Trend
This comparison measures the indicator’s values over multiple time periods.<br>The Mann-Kendall Test for Statistical Significance is used to evaluate the trend<br>over 4 to 10 periods of measure, subject to data availability and comparability.
County: Honolulu Adults with High Blood Cholesterol
County: Honolulu Adults with High Blood Cholesterol
35.9%
(2021)
Compared to:

HI Value
(34.9%)
The regional value is compared to the Hawaii State value.
Median Value for States and Territories
(35.6%)
The regional value is compared to the median value for states and territories.
Prior Value
(30.9%)
Prior Value compares a measured value with the previously measured value. Confidence intervals were taken into account in determining the direction of the comparison.
Trend
This comparison measures the indicator’s values over multiple time periods.<br>The Mann-Kendall Test for Statistical Significance is used to evaluate the trend<br>over 4 to 10 periods of measure, subject to data availability and comparability.
County: Honolulu Adults with High Blood Pressure
County: Honolulu Adults with High Blood Pressure
29.6%
(2021)
Compared to:
HI Value
(29.8%)
The regional value is compared to the Hawaii State value.
Median Value for States and Territories
(11.1%)
The regional value is compared to the median value for states and territories.
Prior Value
(30.3%)
Prior Value compares a measured value with the previously measured value. Confidence intervals were taken into account in determining the direction of the comparison.
Trend
This comparison measures the indicator’s values over multiple time periods.<br>The Mann-Kendall Test for Statistical Significance is used to evaluate the trend<br>over 4 to 10 periods of measure, subject to data availability and comparability.
HP 2030 Target
(42.6%)
<div>HDS-04: Reduce the proportion of adults with high blood pressure<br /> <br />The national indicator excludes pregnant women. The data source for the national indicator is the National Health and Nutrition Examination Survey, which is not conducted in Hawaii. The state data source is the Behavioral Risk Factor Surveillance System, which is self-reported but comparable to the national data source.</div>
County: Honolulu Adults With Two or More Chronic Conditions
County: Honolulu Adults With Two or More Chronic Conditions
34.9%
(2021)
Compared to:
HI Value
(35.8%)
The regional value is compared to the Hawaii State value.
Prior Value
(35.8%)
Prior Value compares a measured value with the previously measured value. Confidence intervals were taken into account in determining the direction of the comparison.
Trend
This comparison measures the indicator’s values over multiple time periods.<br>The Mann-Kendall Test for Statistical Significance is used to evaluate the trend<br>over 4 to 10 periods of measure, subject to data availability and comparability.
County: Honolulu Atrial Fibrillation: Medicare Population
County: Honolulu Atrial Fibrillation: Medicare Population
11.0%
(2022)
Compared to:


U.S. Counties
The distribution is based on data from 3,129 U.S. counties and county equivalents.
HI Value
(11.0%)
The regional value is compared to the Hawaii State value.
US Value
(14.0%)
The regional value is compared to the national value.
Prior Value
(11.0%)
Prior Value compares a measured value with the previously measured value. Confidence intervals were not taken into account in determining the direction of the comparison.
Trend
This comparison measures the indicator’s values over multiple time periods.<br>The Mann-Kendall Test for Statistical Significance is used to evaluate the trend<br>over 4 to 10 periods of measure, subject to data availability and comparability.
County: Honolulu Congestive Heart Failure Death Rate
County: Honolulu Congestive Heart Failure Death Rate
8.6
Deaths per 100,000 population
(2020-2022)
Compared to:
HI Value
(8.2 in 2022)
The regional value is compared to the Hawaii State value.
US Value
(21.6 in 2021)
The regional value is compared to the national value.
Prior Value
(9.3)
Prior Value compares a measured value with the previously measured value. Confidence intervals were taken into account in determining the direction of the comparison.
Trend
This comparison measures the indicator’s values over multiple time periods.<br>The Mann-Kendall Test for Statistical Significance is used to evaluate the trend<br>over 4 to 10 periods of measure, subject to data availability and comparability.
County: Honolulu Coronary Heart Disease Death Rate
County: Honolulu Coronary Heart Disease Death Rate
62.8
Deaths per 100,000 population
(2022)
Compared to:
HI Value
(66.4)
The regional value is compared to the Hawaii State value.
US Value
(92.8 in 2021)
The regional value is compared to the national value.
Prior Value
(61.2)
Prior Value compares a measured value with the previously measured value. Confidence intervals were taken into account in determining the direction of the comparison.
Trend
This comparison measures the indicator’s values over multiple time periods.<br>The Mann-Kendall Test for Statistical Significance is used to evaluate the trend<br>over 4 to 10 periods of measure, subject to data availability and comparability.
HDS Plan Target
(54.3)
HP 2030 Target
(71.1)
<div><span>HDS-02: Reduce coronary heart disease deaths<br /><br />The national indicator definition and data source are the same as for the state.</span></div>
County: Honolulu Diseases of the Heart Death Rate
County: Honolulu Diseases of the Heart Death Rate
119.1
Deaths per 100,000 population
(2022)
Compared to:
HI Value
(124.1)
The regional value is compared to the Hawaii State value.
US Value
(173.8 in 2021)
The regional value is compared to the national value.
Prior Value
(116.3)
Prior Value compares a measured value with the previously measured value. Confidence intervals were taken into account in determining the direction of the comparison.
Trend
This comparison measures the indicator’s values over multiple time periods.<br>The Mann-Kendall Test for Statistical Significance is used to evaluate the trend<br>over 4 to 10 periods of measure, subject to data availability and comparability.
County: Honolulu Heart Failure: Medicare Population
County: Honolulu Heart Failure: Medicare Population
8.0%
(2022)
Compared to:
U.S. Counties
The distribution is based on data from 3,129 U.S. counties and county equivalents.
HI Value
(8.0%)
The regional value is compared to the Hawaii State value.
US Value
(11.0%)
The regional value is compared to the national value.
Prior Value
(8.0%)
Prior Value compares a measured value with the previously measured value. Confidence intervals were not taken into account in determining the direction of the comparison.
Trend
This comparison measures the indicator’s values over multiple time periods.<br>The Mann-Kendall Test for Statistical Significance is used to evaluate the trend<br>over 4 to 10 periods of measure, subject to data availability and comparability.
County: Honolulu Households that Received Cardiology Medical Services
County: Honolulu Households that Received Cardiology Medical Services
11.7%
(2023)
Compared to:
HI Value
(12.6%)
The regional value is compared to the Hawaii State value.
US Value
(11.8%)
The regional value is compared to the national value.
Prior Value
(11.3%)
Prior Value compares a measured value with the previously measured value. Confidence intervals were not taken into account in determining the direction of the comparison.
Trend
This comparison measures the indicator’s values over multiple time periods.<br>The Mann-Kendall Test for Statistical Significance is used to evaluate the trend<br>over 4 to 10 periods of measure, subject to data availability and comparability.
County: Honolulu Hyperlipidemia: Medicare Population
County: Honolulu Hyperlipidemia: Medicare Population
74.0%
(2022)
Compared to:

U.S. Counties
The distribution is based on data from 3,129 U.S. counties and county equivalents.
HI Value
(70.0%)
The regional value is compared to the Hawaii State value.
US Value
(65.0%)
The regional value is compared to the national value.
Prior Value
(73.0%)
Prior Value compares a measured value with the previously measured value. Confidence intervals were not taken into account in determining the direction of the comparison.
Trend
This comparison measures the indicator’s values over multiple time periods.<br>The Mann-Kendall Test for Statistical Significance is used to evaluate the trend<br>over 4 to 10 periods of measure, subject to data availability and comparability.
County: Honolulu Hypertension: Medicare Population
County: Honolulu Hypertension: Medicare Population
67.0%
(2022)
Compared to:

U.S. Counties
The distribution is based on data from 3,129 U.S. counties and county equivalents.
HI Value
(63.0%)
The regional value is compared to the Hawaii State value.
US Value
(65.0%)
The regional value is compared to the national value.
Prior Value
(66.0%)
Prior Value compares a measured value with the previously measured value. Confidence intervals were not taken into account in determining the direction of the comparison.
Trend
This comparison measures the indicator’s values over multiple time periods.<br>The Mann-Kendall Test for Statistical Significance is used to evaluate the trend<br>over 4 to 10 periods of measure, subject to data availability and comparability.
County: Honolulu Ischemic Heart Disease: Medicare Population
County: Honolulu Ischemic Heart Disease: Medicare Population
15.0%
(2022)
Compared to:
U.S. Counties
The distribution is based on data from 3,129 U.S. counties and county equivalents.
HI Value
(14.0%)
The regional value is compared to the Hawaii State value.
US Value
(21.0%)
The regional value is compared to the national value.
Prior Value
(15.0%)
Prior Value compares a measured value with the previously measured value. Confidence intervals were not taken into account in determining the direction of the comparison.
Trend
This comparison measures the indicator’s values over multiple time periods.<br>The Mann-Kendall Test for Statistical Significance is used to evaluate the trend<br>over 4 to 10 periods of measure, subject to data availability and comparability.
County: Honolulu Stroke Death Rate
County: Honolulu Stroke Death Rate
37.3
Deaths per 100,000 population
(2020-2022)
Compared to:
HI Value
(38.6 in 2022)
The regional value is compared to the Hawaii State value.
US Value
(41.1 in 2021)
The regional value is compared to the national value.
Prior Value
(37.0)
Prior Value compares a measured value with the previously measured value. Confidence intervals were taken into account in determining the direction of the comparison.
Trend
This comparison measures the indicator’s values over multiple time periods.<br>The Mann-Kendall Test for Statistical Significance is used to evaluate the trend<br>over 4 to 10 periods of measure, subject to data availability and comparability.
HDS Plan Target
(33.4)
HP 2030 Target
(33.4)
<div><span>HDS-03: Reduce stroke deaths </span></div>
<div><span></span></div>
<div><span>The national indicator definition and data source are the same as for the state</span></div>
County: Honolulu Stroke: Medicare Population
County: Honolulu Stroke: Medicare Population
6.0%
(2022)
Compared to:
U.S. Counties
The distribution is based on data from 3,129 U.S. counties and county equivalents.
HI Value
(5.0%)
The regional value is compared to the Hawaii State value.
US Value
(6.0%)
The regional value is compared to the national value.
Prior Value
(6.0%)
Prior Value compares a measured value with the previously measured value. Confidence intervals were not taken into account in determining the direction of the comparison.
Trend
This comparison measures the indicator’s values over multiple time periods.<br>The Mann-Kendall Test for Statistical Significance is used to evaluate the trend<br>over 4 to 10 periods of measure, subject to data availability and comparability.
