
Advanced Search: Build a Custom Dashboard
In the fields below, search for indicators by location, topics, population, classification, subgroup, or comparison. No fields are required, but we suggest selecting a location or two to start. In the additional search options section, select options to group and order search results. To learn more about how to customize a dashboard, see our help center.
Visit the Indicator List Page to see the full list of indicators and locations available on the site.
Search Results:
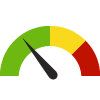
Indicator Gauge Icon Legend
Legend Colors
Red is bad, green is good, blue is not statistically different/neutral.
Compared to Distribution
 the value is in the best half of communities.
 the value is in the 2nd worst quarter of communities.
 the value is in the worst quarter of communities.
Compared to Target
 meets target;
  does not meet target.
Compared to a Single Value
 lower than the comparison value;
 higher than the comparison value;
 not statistically different from comparison value.
Trend

 non-significant change over time;
 significant change over time;
  no change over time.
Compared to Prior Value
 higher than the previous measurement period;
 lower than the previous measurement period;
 no statistically different change from previous measurement period.
Health / Disabilities
Health / Disabilities
County: Hawaii
Value
Compared to:
County: Hawaii Adults 65+ with a Disability
County: Hawaii Adults 65+ with a Disability
33.8%
(2018-2022)
Compared to:


HI Value
(32.5%)
The regional value is compared to the Hawaii State value.
US Value
(33.3%)
The regional value is compared to the national value.
Trend
This comparison measures the indicator’s values over multiple time periods.<br>The Mann-Kendall Test for Statistical Significance is used to evaluate the trend<br>over 4 to 10 periods of measure, subject to data availability and comparability.
County: Hawaii Adults 65+ with a Hearing Difficulty
County: Hawaii Adults 65+ with a Hearing Difficulty
16.0%
(2018-2022)
Compared to:
HI Value
(13.7%)
The regional value is compared to the Hawaii State value.
US Value
(13.7%)
The regional value is compared to the national value.
Trend
This comparison measures the indicator’s values over multiple time periods.<br>The Mann-Kendall Test for Statistical Significance is used to evaluate the trend<br>over 4 to 10 periods of measure, subject to data availability and comparability.
County: Hawaii Adults 65+ with a Self-Care Difficulty
County: Hawaii Adults 65+ with a Self-Care Difficulty
7.2%
(2018-2022)
Compared to:

HI Value
(7.4%)
The regional value is compared to the Hawaii State value.
US Value
(7.4%)
The regional value is compared to the national value.
Trend
This comparison measures the indicator’s values over multiple time periods.<br>The Mann-Kendall Test for Statistical Significance is used to evaluate the trend<br>over 4 to 10 periods of measure, subject to data availability and comparability.
County: Hawaii Adults 65+ with a Vision Difficulty
County: Hawaii Adults 65+ with a Vision Difficulty
6.6%
(2018-2022)
Compared to:
HI Value
(4.9%)
The regional value is compared to the Hawaii State value.
US Value
(6.0%)
The regional value is compared to the national value.
Trend
This comparison measures the indicator’s values over multiple time periods.<br>The Mann-Kendall Test for Statistical Significance is used to evaluate the trend<br>over 4 to 10 periods of measure, subject to data availability and comparability.
County: Hawaii Adults 65+ with an Independent Living Difficulty
County: Hawaii Adults 65+ with an Independent Living Difficulty
13.8%
(2018-2022)
Compared to:
HI Value
(15.6%)
The regional value is compared to the Hawaii State value.
US Value
(13.6%)
The regional value is compared to the national value.
Trend
This comparison measures the indicator’s values over multiple time periods.<br>The Mann-Kendall Test for Statistical Significance is used to evaluate the trend<br>over 4 to 10 periods of measure, subject to data availability and comparability.
County: Hawaii Adults with a Cognitive Disability
County: Hawaii Adults with a Cognitive Disability
12.4%
(2022)
Compared to:


HI Value
(9.1%)
The regional value is compared to the Hawaii State value.
Median Value for States and Territories
(13.4%)
The regional value is compared to the median value for states and territories.
Prior Value
(10.2%)
Prior Value compares a measured value with the previously measured value. Confidence intervals were taken into account in determining the direction of the comparison.
Trend
This comparison measures the indicator’s values over multiple time periods.<br>The Mann-Kendall Test for Statistical Significance is used to evaluate the trend<br>over 4 to 10 periods of measure, subject to data availability and comparability.
County: Hawaii Adults with a Disability
County: Hawaii Adults with a Disability
28.6%
(2022)
Compared to:
HI Value
(24.1%)
The regional value is compared to the Hawaii State value.
Median Value for States and Territories
(27.6% in 2019)
The regional value is compared to the median value for states and territories.
Prior Value
(26.7%)
Prior Value compares a measured value with the previously measured value. Confidence intervals were taken into account in determining the direction of the comparison.
Trend
This comparison measures the indicator’s values over multiple time periods.<br>The Mann-Kendall Test for Statistical Significance is used to evaluate the trend<br>over 4 to 10 periods of measure, subject to data availability and comparability.
County: Hawaii Adults with a Self-Care Disability
County: Hawaii Adults with a Self-Care Disability
2.8%
(2022)
Compared to:
HI Value
(2.2%)
The regional value is compared to the Hawaii State value.
Median Value for States and Territories
(3.5%)
The regional value is compared to the median value for states and territories.
Prior Value
(2.9%)
Prior Value compares a measured value with the previously measured value. Confidence intervals were taken into account in determining the direction of the comparison.
Trend
This comparison measures the indicator’s values over multiple time periods.<br>The Mann-Kendall Test for Statistical Significance is used to evaluate the trend<br>over 4 to 10 periods of measure, subject to data availability and comparability.
County: Hawaii Adults with a Vision Disability
County: Hawaii Adults with a Vision Disability
5.9%
(2022)
Compared to:
HI Value
(4.0%)
The regional value is compared to the Hawaii State value.
Median Value for States and Territories
(5.3%)
The regional value is compared to the median value for states and territories.
Prior Value
(5.0%)
Prior Value compares a measured value with the previously measured value. Confidence intervals were taken into account in determining the direction of the comparison.
Trend
This comparison measures the indicator’s values over multiple time periods.<br>The Mann-Kendall Test for Statistical Significance is used to evaluate the trend<br>over 4 to 10 periods of measure, subject to data availability and comparability.
County: Hawaii Adults with Activity Limitations due to Arthritis
County: Hawaii Adults with Activity Limitations due to Arthritis
44.5%
(2021)
Compared to:
HI Value
(35.5%)
The regional value is compared to the Hawaii State value.
Median Value for States and Territories
(41.4%)
The regional value is compared to the median value for states and territories.
Prior Value
(34.1%)
Prior Value compares a measured value with the previously measured value. Confidence intervals were taken into account in determining the direction of the comparison.
Trend
This comparison measures the indicator’s values over multiple time periods.<br>The Mann-Kendall Test for Statistical Significance is used to evaluate the trend<br>over 4 to 10 periods of measure, subject to data availability and comparability.
HP 2030 Target
(38.7%)
<div><span>A-02: Reduce the proportion of adults with arthritis whose arthritis limits their activities<br /> <br />The national indicator is defined in exactly the same way. The data source for the national indicator is the National Health Interview Survey, from which state-level data for Hawaii cannot be obtained. The state data source is the Behavioral Risk Factor Surveillance System, which is comparable to the national data source.</span></div>
County: Hawaii Adults with an Ambulatory Disability
County: Hawaii Adults with an Ambulatory Disability
13.0%
(2022)
Compared to:
HI Value
(10.7%)
The regional value is compared to the Hawaii State value.
Median Value for States and Territories
(13.3%)
The regional value is compared to the median value for states and territories.
Prior Value
(12.3%)
Prior Value compares a measured value with the previously measured value. Confidence intervals were taken into account in determining the direction of the comparison.
Trend
This comparison measures the indicator’s values over multiple time periods.<br>The Mann-Kendall Test for Statistical Significance is used to evaluate the trend<br>over 4 to 10 periods of measure, subject to data availability and comparability.
County: Hawaii Adults with an Independent Living Disability
County: Hawaii Adults with an Independent Living Disability
6.8%
(2022)
Compared to:
HI Value
(5.7%)
The regional value is compared to the Hawaii State value.
Median Value for States and Territories
(7.6%)
The regional value is compared to the median value for states and territories.
Prior Value
(6.2%)
Prior Value compares a measured value with the previously measured value. Confidence intervals were taken into account in determining the direction of the comparison.
Trend
This comparison measures the indicator’s values over multiple time periods.<br>The Mann-Kendall Test for Statistical Significance is used to evaluate the trend<br>over 4 to 10 periods of measure, subject to data availability and comparability.
County: Hawaii Adults with CKD Who Have High Blood Pressure
County: Hawaii Adults with CKD Who Have High Blood Pressure
61.6%
(2019, 2021)
Compared to:
HI Value
(68.3%)
The regional value is compared to the Hawaii State value.
Prior Value
(64.3%)
Prior Value compares a measured value with the previously measured value. Confidence intervals were taken into account in determining the direction of the comparison.
Trend
This comparison measures the indicator’s values over multiple time periods.<br>The Mann-Kendall Test for Statistical Significance is used to evaluate the trend<br>over 4 to 10 periods of measure, subject to data availability and comparability.
HP 2030 Target
(42.8%)
<div><span>CKD-06: Reduce the proportion of adults with chronic kidney disease who have elevated blood pressure<br /><br />The data source for the national indicator is the National Health and Nutrition Examination Survey, from which state-level data for Hawaii cannot be obtained. The state data source is the Behavioral Risk Factor Surveillance System, which is comparable to the national data source. </span></div>
County: Hawaii Adults with Disability Living in Poverty
County: Hawaii Adults with Disability Living in Poverty
22.0%
(2018-2022)
Compared to:
U.S. Counties
The distribution is based on data from 3,132 U.S. counties and county equivalents.
HI Value
(19.9%)
The regional value is compared to the Hawaii State value.
US Value
(24.9%)
The regional value is compared to the national value.
Trend
This comparison measures the indicator’s values over multiple time periods.<br>The Mann-Kendall Test for Statistical Significance is used to evaluate the trend<br>over 4 to 10 periods of measure, subject to data availability and comparability.
County: Hawaii Adults with Medical Conditions Limiting Lifestyle
County: Hawaii Adults with Medical Conditions Limiting Lifestyle
37.4%
(2023)
Compared to:

HI Value
(33.2%)
The regional value is compared to the Hawaii State value.
US Value
(33.6%)
The regional value is compared to the national value.
Prior Value
(39.8%)
Prior Value compares a measured value with the previously measured value. Confidence intervals were not taken into account in determining the direction of the comparison.
County: Hawaii Adults with Work Limitations due to Arthritis
County: Hawaii Adults with Work Limitations due to Arthritis
32.9%
(2021)
Compared to:
HI Value
(27.9%)
The regional value is compared to the Hawaii State value.
Median Value for States and Territories
(29.9%)
The regional value is compared to the median value for states and territories.
Prior Value
(34.9%)
Prior Value compares a measured value with the previously measured value. Confidence intervals were taken into account in determining the direction of the comparison.
Trend
This comparison measures the indicator’s values over multiple time periods.<br>The Mann-Kendall Test for Statistical Significance is used to evaluate the trend<br>over 4 to 10 periods of measure, subject to data availability and comparability.
HP 2030 Target
(34.7%)
<div><span>A-03: Reduce the proportion of adults with arthritis whose arthritis limits their work<br /> <br />The national indicator is limited to adults aged 18-64. The data source for the national indicator is the National Health Interview Survey, from which state-level data for Hawaii cannot be obtained. The state data source is the Behavioral Risk Factor Surveillance System, which is comparable to the national data source.</span></div>
County: Hawaii Children with a Disability
County: Hawaii Children with a Disability
5.1%
(2018-2022)
Compared to:

HI Value
(3.4%)
The regional value is compared to the Hawaii State value.
US Value
(4.5%)
The regional value is compared to the national value.
Trend
This comparison measures the indicator’s values over multiple time periods.<br>The Mann-Kendall Test for Statistical Significance is used to evaluate the trend<br>over 4 to 10 periods of measure, subject to data availability and comparability.
County: Hawaii Persons with a Cognitive Difficulty
County: Hawaii Persons with a Cognitive Difficulty
6.7%
(2018-2022)
Compared to:
HI Value
(4.9%)
The regional value is compared to the Hawaii State value.
US Value
(5.3%)
The regional value is compared to the national value.
Trend
This comparison measures the indicator’s values over multiple time periods.<br>The Mann-Kendall Test for Statistical Significance is used to evaluate the trend<br>over 4 to 10 periods of measure, subject to data availability and comparability.
County: Hawaii Persons with a Disability
County: Hawaii Persons with a Disability
15.3%
(2018-2022)
Compared to:
HI Value
(12.0%)
The regional value is compared to the Hawaii State value.
US Value
(12.9%)
The regional value is compared to the national value.
Trend
This comparison measures the indicator’s values over multiple time periods.<br>The Mann-Kendall Test for Statistical Significance is used to evaluate the trend<br>over 4 to 10 periods of measure, subject to data availability and comparability.
County: Hawaii Persons with a Hearing Difficulty
County: Hawaii Persons with a Hearing Difficulty
5.3%
(2018-2022)
Compared to:

HI Value
(3.8%)
The regional value is compared to the Hawaii State value.
US Value
(3.6%)
The regional value is compared to the national value.
Trend
This comparison measures the indicator’s values over multiple time periods.<br>The Mann-Kendall Test for Statistical Significance is used to evaluate the trend<br>over 4 to 10 periods of measure, subject to data availability and comparability.
County: Hawaii Persons with a Self-Care Difficulty
County: Hawaii Persons with a Self-Care Difficulty
2.8%
(2018-2022)
Compared to:
HI Value
(2.5%)
The regional value is compared to the Hawaii State value.
US Value
(2.6%)
The regional value is compared to the national value.
Trend
This comparison measures the indicator’s values over multiple time periods.<br>The Mann-Kendall Test for Statistical Significance is used to evaluate the trend<br>over 4 to 10 periods of measure, subject to data availability and comparability.
County: Hawaii Persons with a Vision Difficulty
County: Hawaii Persons with a Vision Difficulty
3.1%
(2018-2022)
Compared to:
HI Value
(2.0%)
The regional value is compared to the Hawaii State value.
US Value
(2.4%)
The regional value is compared to the national value.
Trend
This comparison measures the indicator’s values over multiple time periods.<br>The Mann-Kendall Test for Statistical Significance is used to evaluate the trend<br>over 4 to 10 periods of measure, subject to data availability and comparability.
County: Hawaii Persons with an Ambulatory Difficulty
County: Hawaii Persons with an Ambulatory Difficulty
7.2%
(2018-2022)
Compared to:
HI Value
(6.4%)
The regional value is compared to the Hawaii State value.
US Value
(6.7%)
The regional value is compared to the national value.
Trend
This comparison measures the indicator’s values over multiple time periods.<br>The Mann-Kendall Test for Statistical Significance is used to evaluate the trend<br>over 4 to 10 periods of measure, subject to data availability and comparability.
