
Search for Indicators
Socioeconomic Status Tracker
Socioeconomic status is a combination of many factors that define an individual’s or group’s position within the social structure. Most commonly, measures of socioeconomic status include occupation, education, and income. These reflect the distribution of resources and correlate to health and quality-of-life status in the population. People of lower socioeconomic status suffer disproportionately from disease and mortality compared to people of higher socioeconomic status.

Indicator Gauge Icon Legend
Legend Colors
Red is bad, green is good, blue is not statistically different/neutral.
Compared to Distribution
 the value is in the best half of communities.
 the value is in the 2nd worst quarter of communities.
 the value is in the worst quarter of communities.
Compared to Target
 meets target;
  does not meet target.
Compared to a Single Value
 lower than the comparison value;
 higher than the comparison value;
 not statistically different from comparison value.
Trend

 non-significant change over time;
 significant change over time;
  no change over time.
Compared to Prior Value
 higher than the previous measurement period;
 lower than the previous measurement period;
 no statistically different change from previous measurement period.
State: Hawaii
SES
Value
Compared to:
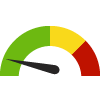
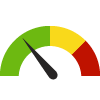
State: Hawaii Median Household Income
State: Hawaii Median Household Income
$94,814
(2018-2022)
Compared to:
U.S. States
The distribution is based on data from 50 U.S. states and the District of Columbia.
US Value
($75,149)
The regional value is compared to the national value.
Trend
This comparison measures the indicator’s values over multiple time periods.<br>The Mann-Kendall Test for Statistical Significance is used to evaluate the trend<br>over 4 to 10 periods of measure, subject to data availability and comparability.
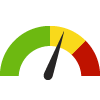
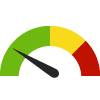
State: Hawaii Income Inequality
State: Hawaii Income Inequality
0.447
(2018-2022)
Compared to:

U.S. States
The distribution is based on data from 50 U.S. states and the District of Columbia.
US Value
(0.483)
The regional value is compared to the national value.
Trend
This comparison measures the indicator’s values over multiple time periods.<br>The Mann-Kendall Test for Statistical Significance is used to evaluate the trend<br>over 4 to 10 periods of measure, subject to data availability and comparability.
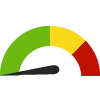
State: Hawaii Unemployed Workers in Civilian Labor Force
State: Hawaii Unemployed Workers in Civilian Labor Force
2.9%
(November 2023)
Compared to:

U.S. States
The distribution is based on non-seasonally-adjusted data from 50 U.S. states and the District of Columbia.
US Value
(3.5%)
The regional value is compared to the national value.
Prior Value
(3.1%)
Prior Value compares a measured value with the previously measured value. Confidence intervals were not taken into account in determining the direction of the comparison.
Trend
This comparison measures the indicator’s values over multiple time periods.<br>The Mann-Kendall Test for Statistical Significance is used to evaluate the trend<br>over 4 to 10 periods of measure, subject to data availability and comparability.
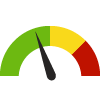
State: Hawaii People 25+ with a High School Diploma or Higher
State: Hawaii People 25+ with a High School Diploma or Higher
92.7%
(2018-2022)
Compared to:
U.S. States
The distribution is based on data from 50 U.S. states and the District of Columbia.
US Value
(89.1%)
The regional value is compared to the national value.
Trend
This comparison measures the indicator’s values over multiple time periods.<br>The Mann-Kendall Test for Statistical Significance is used to evaluate the trend<br>over 4 to 10 periods of measure, subject to data availability and comparability.
State: Hawaii People 25+ with a Bachelor's Degree or Higher
State: Hawaii People 25+ with a Bachelor's Degree or Higher
34.7%
(2018-2022)
Compared to:
U.S. States
The distribution is based on data from 50 U.S. states and the District of Columbia.
US Value
(34.3%)
The regional value is compared to the national value.
Trend
This comparison measures the indicator’s values over multiple time periods.<br>The Mann-Kendall Test for Statistical Significance is used to evaluate the trend<br>over 4 to 10 periods of measure, subject to data availability and comparability.
State: Hawaii
Poverty
Value
Compared to:
State: Hawaii People Living Below Poverty Level
State: Hawaii People Living Below Poverty Level
9.6%
(2018-2022)
Compared to:
U.S. States
The distribution is based on data from 50 U.S. states and the District of Columbia.
US Value
(12.5%)
The regional value is compared to the national value.
Trend
This comparison measures the indicator’s values over multiple time periods.<br>The Mann-Kendall Test for Statistical Significance is used to evaluate the trend<br>over 4 to 10 periods of measure, subject to data availability and comparability.
HP 2030 Target
(8.0%)
<div>SDOH-01: Reduce the proportion of people living in poverty</div>
State: Hawaii Households with Cash Public Assistance Income
State: Hawaii Households with Cash Public Assistance Income
4.0%
(2018-2022)
Compared to:


U.S. States
The distribution is based on data from 50 U.S. states and the District of Columbia.
US Value
(2.7%)
The regional value is compared to the national value.
Trend
This comparison measures the indicator’s values over multiple time periods.<br>The Mann-Kendall Test for Statistical Significance is used to evaluate the trend<br>over 4 to 10 periods of measure, subject to data availability and comparability.
State: Hawaii
Neighborhood and Housing
Value
Compared to:
State: Hawaii Liquor Store Density
State: Hawaii Liquor Store Density
4.2
Stores per 100,000 population
(2021)
Compared to:

U.S. States
The distribution is based on data from 50 U.S. states and the District of Columbia.
US Value
(10.7)
The regional value is compared to the national value.
Prior Value
(4.1)
Prior Value compares a measured value with the previously measured value. Confidence intervals were not taken into account in determining the direction of the comparison.
Trend
This comparison measures the indicator’s values over multiple time periods.<br>The Mann-Kendall Test for Statistical Significance is used to evaluate the trend<br>over 4 to 10 periods of measure, subject to data availability and comparability.
State: Hawaii Renters Spending 30% or More of Household Income on Rent
State: Hawaii Renters Spending 30% or More of Household Income on Rent
55.8%
(2018-2022)
Compared to:
U.S. States
The distribution is based on data from 50 U.S. states and the District of Columbia.
US Value
(49.9%)
The regional value is compared to the national value.
Trend
This comparison measures the indicator’s values over multiple time periods.<br>The Mann-Kendall Test for Statistical Significance is used to evaluate the trend<br>over 4 to 10 periods of measure, subject to data availability and comparability.
HP 2030 Target
(25.5%)
<div>SDOH-04: Reduce the proportion of families that spend more than 30 percent of income on housing</div>
<div> </div>
<div>The data source for the national indicator is the American Housing Survey from which state-level data cannot be obtained. The state data source is the American Community Survey which is comparable to the national data source but the denominator is renter-occupied housing units rather than households. </div>
<div> </div>
State: Hawaii High Housing Burden
State: Hawaii High Housing Burden
39.0%
Percent of households
(2016-2020)
Compared to:
US Value
(31.3%)
The regional value is compared to the national value.
Prior Value
(39.5%)
Prior Value compares a measured value with the previously measured value. Confidence intervals were not taken into account in determining the direction of the comparison.
Trend
This comparison measures the indicator’s values over multiple time periods.<br>The Mann-Kendall Test for Statistical Significance is used to evaluate the trend<br>over 4 to 10 periods of measure, subject to data availability and comparability.
State: Hawaii Severe Housing Problems
State: Hawaii Severe Housing Problems
25.7%
(2016-2020)
Compared to:
U.S. States
The distribution is based on data from 50 U.S. states and the District of Columbia.
US Value
(16.7%)
The regional value is compared to the national value.
Prior Value
(26.2%)
Prior Value compares a measured value with the previously measured value. Confidence intervals were taken into account in determining the direction of the comparison.
Trend
This comparison measures the indicator’s values over multiple time periods.<br>The Mann-Kendall Test for Statistical Significance is used to evaluate the trend<br>over 4 to 10 periods of measure, subject to data availability and comparability.
State: Hawaii
Access to Health Services
Value
Compared to:
State: Hawaii Adults with a Usual Source of Health Care
State: Hawaii Adults with a Usual Source of Health Care
88.4%
(2022)
Compared to:
Median Value for States and Territories
(76.8%)
The regional value is compared to the median value for states and territories.
Prior Value
(90.1%)
Prior Value compares a measured value with the previously measured value. Confidence intervals were taken into account in determining the direction of the comparison.
Trend
This comparison measures the indicator’s values over multiple time periods.<br>The Mann-Kendall Test for Statistical Significance is used to evaluate the trend<br>over 4 to 10 periods of measure, subject to data availability and comparability.
PAN Plan Target
(83.9%)
State: Hawaii Adults Who Did Not See a Doctor Due to Cost
State: Hawaii Adults Who Did Not See a Doctor Due to Cost
5.7%
(2022)
Compared to:
Median Value for States and Territories
(10.1%)
The regional value is compared to the median value for states and territories.
Prior Value
(5.3%)
Prior Value compares a measured value with the previously measured value. Confidence intervals were taken into account in determining the direction of the comparison.
Trend
This comparison measures the indicator’s values over multiple time periods.<br>The Mann-Kendall Test for Statistical Significance is used to evaluate the trend<br>over 4 to 10 periods of measure, subject to data availability and comparability.
State: Hawaii
Access to Resources for Healthy Living
Value
Compared to:
State: Hawaii Access to Exercise Opportunities
State: Hawaii Access to Exercise Opportunities
91.7%
(2024)
Compared to:

U.S. States
The distribution is based on data from 50 U.S. states and the District of Columbia.
US Value
(84.1%)
The regional value is compared to the national value.
Prior Value
(93.7%)
Prior Value compares a measured value with the previously measured value. Confidence intervals were not taken into account in determining the direction of the comparison.
State: Hawaii Food Environment Index
State: Hawaii Food Environment Index
7.4
(2024)
Compared to:

U.S. States
The distribution is based on data from 50 U.S. states and the District of Columbia.
US Value
(7.7)
The regional value is compared to the national value.
Prior Value
(7.9)
Prior Value compares a measured value with the previously measured value. Confidence intervals were not taken into account in determining the direction of the comparison.
Trend
This comparison measures the indicator’s values over multiple time periods.<br>The Mann-Kendall Test for Statistical Significance is used to evaluate the trend<br>over 4 to 10 periods of measure, subject to data availability and comparability.
State: Hawaii Households that Are Food Insecure
State: Hawaii Households that Are Food Insecure
9.0%
(2019-2021)
Compared to:
US Value
(10.4%)
The regional value is compared to the national value.
Prior Value
(9.0%)
Prior Value compares a measured value with the previously measured value. Confidence intervals were taken into account in determining the direction of the comparison.
Trend
This comparison measures the indicator’s values over multiple time periods.<br>The Mann-Kendall Test for Statistical Significance is used to evaluate the trend<br>over 4 to 10 periods of measure, subject to data availability and comparability.
HP 2030 LHI
(6.0%)
<div><span>NWS-01: Reduce household food insecurity and hunger <strong>(LEADING HEALTH INDICATOR)</strong><br /> <br />The national indicator definition and data source are the same as for the state.</span></div>
PAN Plan Target
(6.0%)
State: Hawaii
Populations with Special Needs
Value
Compared to:
State: Hawaii Adults with a Disability
State: Hawaii Adults with a Disability
24.1%
(2022)
Compared to:
Median Value for States and Territories
(27.6% in 2019)
The regional value is compared to the median value for states and territories.
Prior Value
(22.5%)
Prior Value compares a measured value with the previously measured value. Confidence intervals were taken into account in determining the direction of the comparison.
Trend
This comparison measures the indicator’s values over multiple time periods.<br>The Mann-Kendall Test for Statistical Significance is used to evaluate the trend<br>over 4 to 10 periods of measure, subject to data availability and comparability.
25.7%
(2018-2022)
Compared to:


US Value
(21.7%)
The regional value is compared to the national value.
Trend
This comparison measures the indicator’s values over multiple time periods.<br>The Mann-Kendall Test for Statistical Significance is used to evaluate the trend<br>over 4 to 10 periods of measure, subject to data availability and comparability.
State: Hawaii Sexual Minority Adults
State: Hawaii Sexual Minority Adults
6.1%
(2022)
Compared to:

Prior Value
(6.4%)
Prior Value compares a measured value with the previously measured value. Confidence intervals were taken into account in determining the direction of the comparison.
Trend
This comparison measures the indicator’s values over multiple time periods.<br>The Mann-Kendall Test for Statistical Significance is used to evaluate the trend<br>over 4 to 10 periods of measure, subject to data availability and comparability.
State: Hawaii Homelessness Rate
State: Hawaii Homelessness Rate
43.2
Per 10,000 population
(2023)
Compared to:
US Value
(17.5 in 2022)
The regional value is compared to the national value.
Prior Value
(41.3)
Prior Value compares a measured value with the previously measured value. Confidence intervals were not taken into account in determining the direction of the comparison.
Trend
This comparison measures the indicator’s values over multiple time periods.<br>The Mann-Kendall Test for Statistical Significance is used to evaluate the trend<br>over 4 to 10 periods of measure, subject to data availability and comparability.
